

'Lucky' Hull don't have the xG factor (but I think they'll win the play-offs)
Under The Spotlight: Hull’s season defies the underlying numbers. Here’s what the data really says about how they play, and how sustainable it is.

Hull City have taken 41 points from their last 20 Championship fixtures, going back to the start of October. A return of 2.10 points per game across nearly half a season doesn’t just underline their play-off credentials – it can’t be bettered by any side in the second tier. So, why are they still catching flak?
The answer, apparently, is luck. In football discourse, ‘lucky’ is often the label applied when success doesn’t fit the expected narrative. Hull, sitting 4th in the table and level on points with Ipswich Town, have been held up as data outliers whose performances cannot sustain results. Except: results have sustained. And that makes the ‘lucky’ tag feel dismissive (in certain cases, it says more about the observer’s understanding of the club).
In defending the Tigers against criticism of their performance data, Barry Cooper of Hull Live made a point that caught my attention; a point that reflects a popular scepticism toward advanced metrics; a point with which I strongly disagree.
“[Hull] City may be near the bottom of the ‘xG’ table, but who cares? Expected goals (xG) is the latest nonsensical stat that dominates conversation and proves very little.”
Hull are data outliers. That doesn’t mean their success is fake, nor that the concept of expected goals is broken. It means underlying numbers, like the team itself, demand explanation rather than dismissal. Without them, we’re left judging teams on results and vibes alone.
What follows is an attempt to understand those numbers – not to diminish Hull, but to explain them.
The ‘xG factor’
Expected goals (xG) estimate the quality of chances created and conceded, and they form the backbone of the case against Hull’s position near the top of the division.
Exhibit A: Over a 5-game rolling average, the number of goals scored by Hull has outpaced their expected goals throughout the season.
The chances that Hull have created across the campaign don’t accurately predict the number of goals they have scored. Overperforming xG isn’t an illusion, however; it simply reflects the quality of finishing. Over a handful of matches this might be dismissed as a hot streak, or even poor goalkeeping, but this pattern has been stretched across 28 games.
Why is Hull’s xG consistently lower than their goal output? Volume! Hull take comparatively few shots – the 6th-lowest average in the Championship, at 11.32 per game – but they turn a disproportionate number of those efforts into attempts that test the goalkeeper, ranking 6th for shots on target (4.32 per 90 minutes).
Exhibit B: Over a 5-game rolling average, the number of goals that Hull have conceded tends to be fewer than the xG against them.
Point of order: Hull have conceded more goals than 4 of the bottom 6 teams in the Championship. Per the xGA, they should have conceded more goals still. So, why haven’t they? There are two plausible explanations – the first, rooted in the human factor.
If Hull’s players are finishing at an elite level, it follows that their opponents may be finishing below expectation. Chance quality doesn’t guarantee outcomes. Conversion remains a skill, or a failure, at both ends of the pitch.
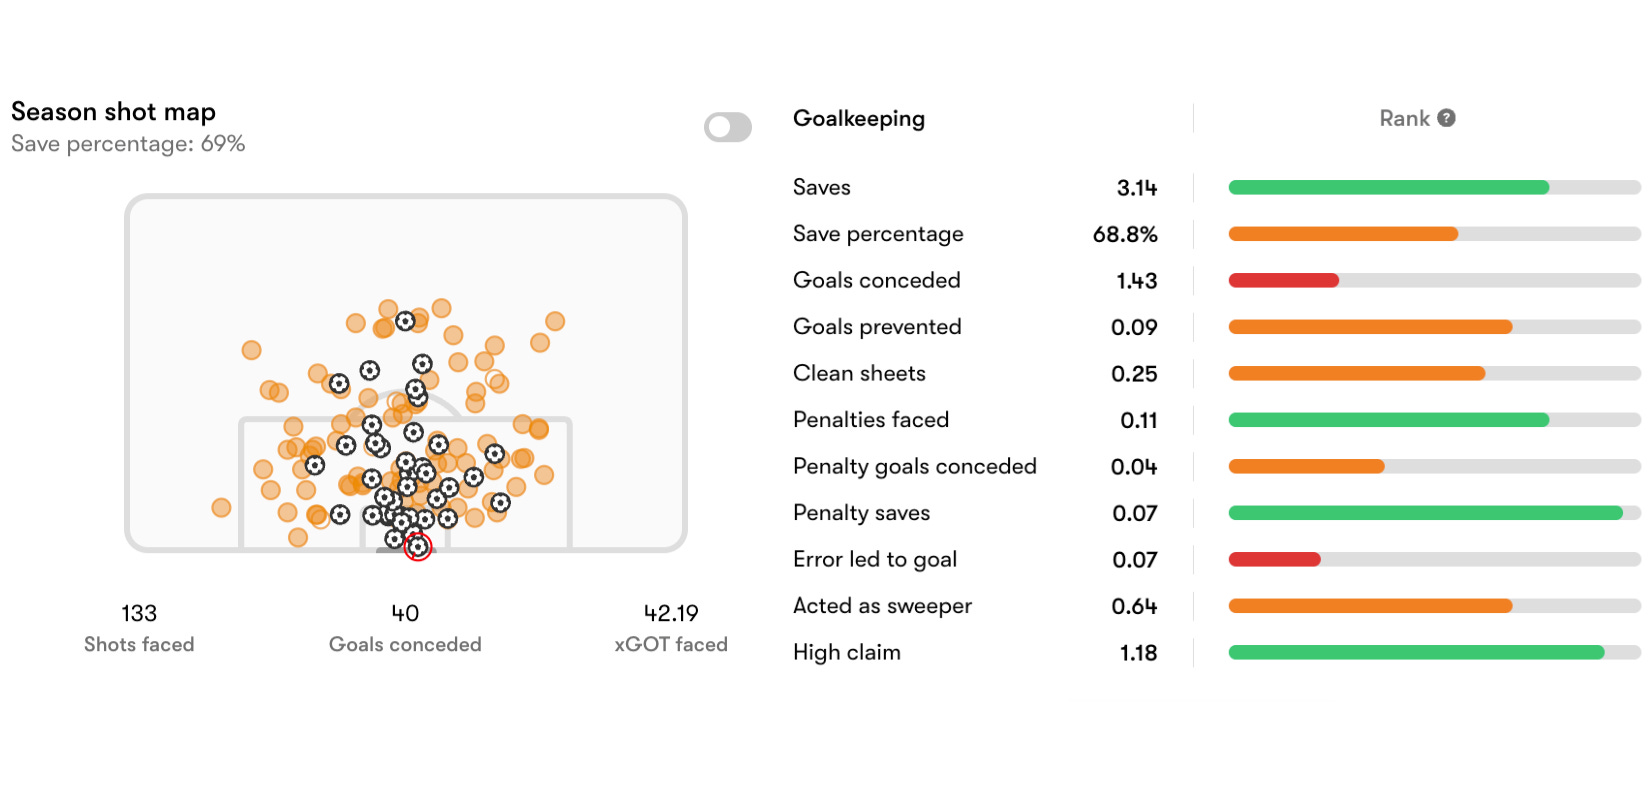
Then there’s the man between the posts. Above-average shot-stopping from Ivor Pandur has played its part, with Hull conceding 40 goals from 42.19 xGOT. These aren’t world-beating numbers, but they are good.
Second, and this is an important point: not all statistics are measured equally. The xG figures referenced here are Opta-based, but we understand that different data providers choose to model expected goals in different ways, and some show Hull’s xGA to be much closer to the number of goals they’ve conceded.
It’s a reminder that xG is a data point, not a verdict, and judging any side on a single model can be misleading – a question discussed in more depth here.

But let’s end the xG section by looking at goal difference vs expected goal difference, which can help to unpick how far the ‘Hull narrative’ is driven by outcomes.
Exhibit C: Over a 5-game rolling average, the xGD difference is increasing whilst Hull are on a hot streak.
Recently, Hull’s goal difference has surged while their xGD remains negative. This is a sign that outcomes are increasingly being decided by conversion and variance, not the Tigers having a tight grip on games. In last weekend’s 2-1 win over Swansea, for example, Swans striker Žan Vipotnik missed a couple of sitters (which was in itself an act of variance, as Vipotnik had scored 13 league goals from just 4.88 xG up to then).
The xG evidence points to some degree of overperformance across the board. But it’s chance conversion and scoring goals that have given Hull the biggest edge.
Taking chances
Exhibit D: Hull players, so far this season, are the best finishers in the league.
Only Coventry score more goals per 90 than Hull, and only Coventry and Sheffield United generate a higher xG per shot.
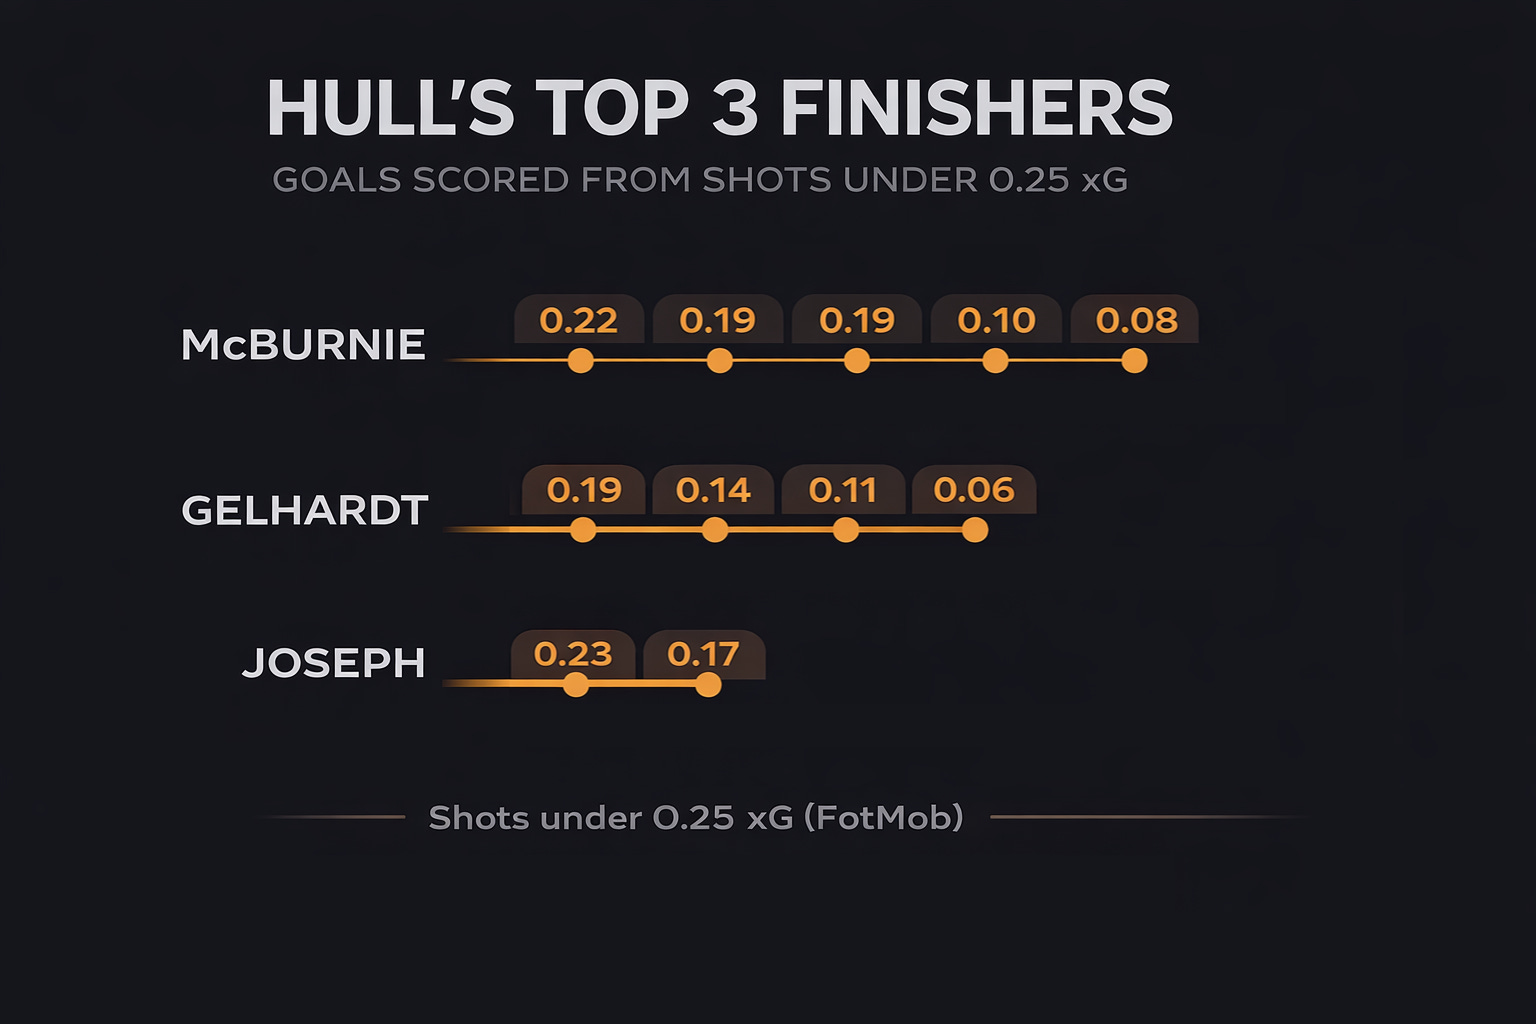
Frame it however you like, but this is overperformance driven by finishing – and, at times, gobsmacking finishing. Oli McBurnie has scored 11 goals from 6.9 xG. Joe Gelhardt has scored 10 from 6.3.
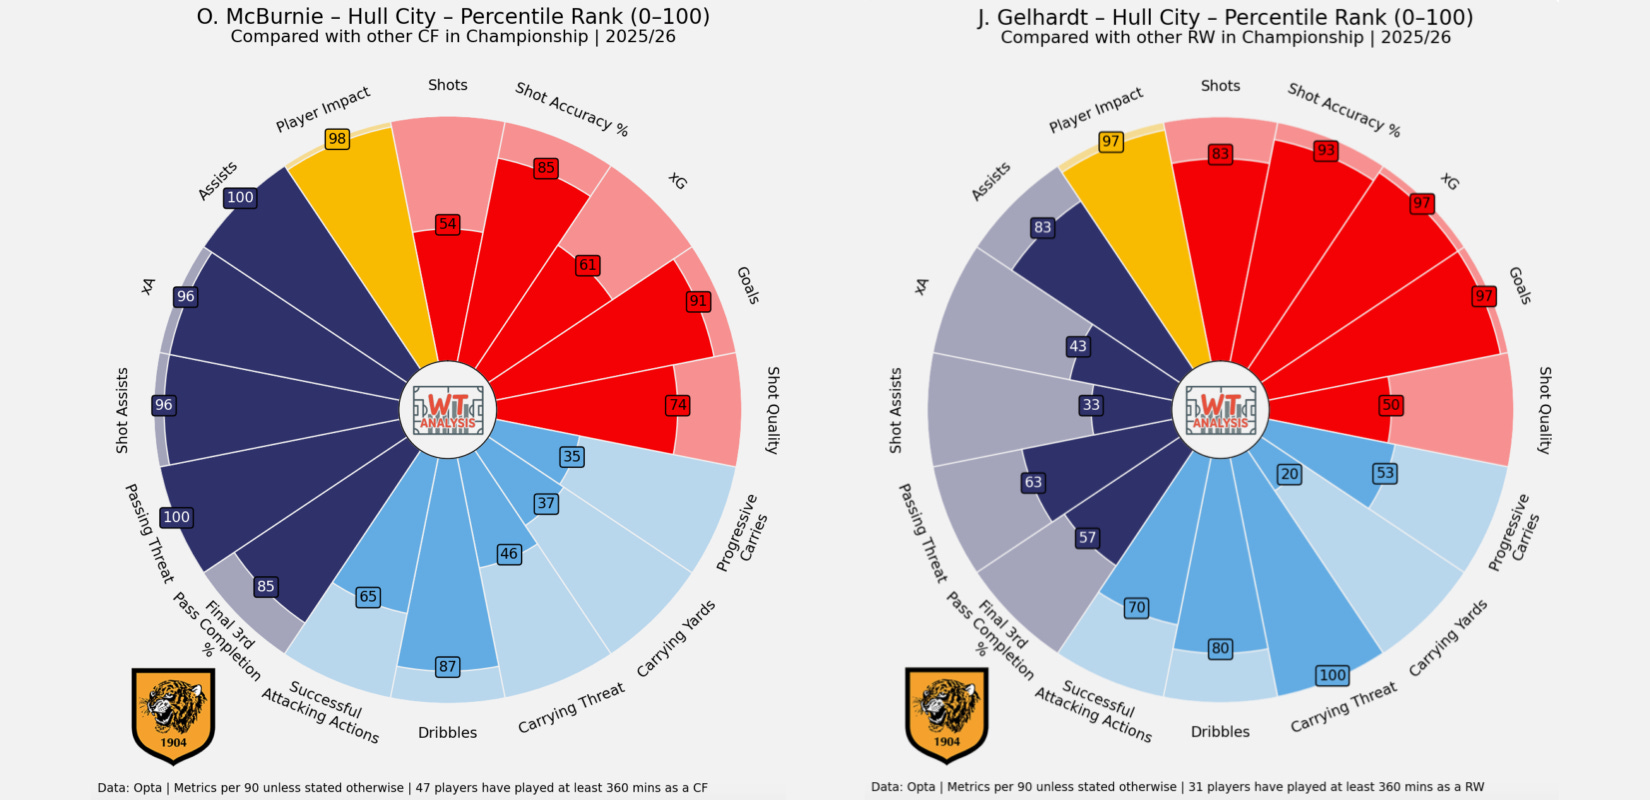
Even with Kyle Joseph passing up some good chances (7 goals from 8.2 xG), those three players have together scored 28 goals from just 21.4 expected. That’s 60% of Hull’s 47 goals. It’s a riot. It’s a hoot. It’s a long, hot streak of goalscoring genius that, rather than being diminished by supposedly “nonsensical” xG metrics, is in fact explained by them.
If those players were unavailable, could Hull rely on their next top scorer? Doubtful – there’s five of them, all tied on two goals each. The human matters. If, in the moment before they took a shot, you transmogrified Hull’s ‘Lethal Trio’ into, say, a large black and orange cat, their xG would look the same; the goal return would not.
Which brings us to the most interesting question of all: not how Hull take their chances, but how they create them in the first place.
Making chances
Exhibit E: On the one hand, Hull have created the 6th-most ‘big chances’ per 90…
Hull create the sixth-highest number of big chances per game (2.39) despite taking the sixth-fewest shots (11.32 per 90). How does that work? The answer lies in style.
Sergej Jakirović sets Hull up in a 4-2-3-1 where his side are comfortable if not happiest without the ball. They rank 21st for possession, averaging 45.2%, and 19th for accurate passes per game. That places them firmly among the Championship’s more direct (not hoofball!) teams, alongside sides such as Preston, Millwall and Wrexham – who are all, intriguingly, also around the play-off places.
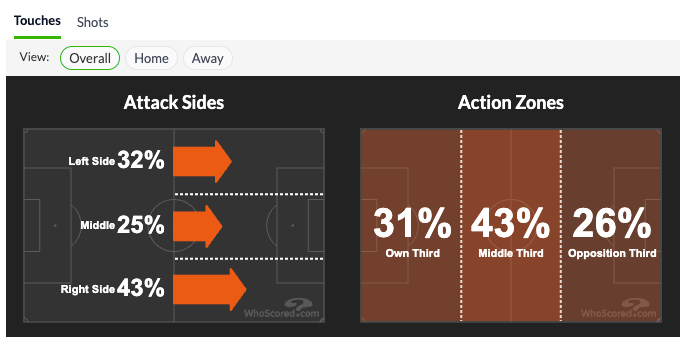
This is deliberate. Hull play the fourth-highest number of accurate long balls per game (27.8), prioritising quick progression over long spells of control. That doesn’t mean they have no control; it means they try to control the more chaotic transitions. That, after all, is when the most advantage can be gained. They want to counter, stretch the pitch early, and play decisive vertical passes before opposition defences are set. The trade-off is lower shot volume; the payoff is better chances.
Exhibit F: …on the other hand, when defending their own box, Hull have given up the 3rd-highest number of big chances per 90 to the opposition.
Hull concede big chances at one of the highest rates in the league (2.43 per 90). However, teams are not missing chances against Hull at an unusual rate – only 66% of the time, when the league average is 63% – which matters because it rules out opponents’ profligacy as the main explanation for their own defensive outcomes.
Instead, the story is one of volume. Hull allow a high frequency of high-quality chances, so they will naturally be helped by good goalkeeping and fine margins (the opposition missing these opportunities). However, the fact they concede the 6th-most big chances per 90 and the 6th-most goals per 90 suggests there’s no grand overperformance here.
Now for the most important area of all: the box.
Inside both boxes
Exhibit G: Hull generally allow more touches in the box to their opposition than most teams do.
Hull’s style deliberately invites pressure. By conceding territory and prioritising quick transitions, they allow opponents into the penalty area with notable frequency. They do not suppress shots.
At the same time, Hull are extremely efficient with the box touches they themselves create, scoring once every 12.5 touches in the penalty area – a very high return. Of course, not all goals come from inside the box… but 45 of Hull’s 46 have. No team in the Championship has scored fewer goals from distance. Hull’s points tally and high ratio of goals to xG are not a result of match-winning worldies each week.
The key wrinkle is where those goals come from. Of the 45 goals scored in the penalty area, just 10 goals have had their final touch inside the six-yard box. Hull tend to find the net from slightly deeper zones rather than tap-in range, which helps to explain why their xG lags behind their goal output.
And that brings us to the final question – the one that rankles most with Hull. Because when people argue that a team’s underlying numbers are unsustainable, what they’re really doing is calling them lucky. And I get it: that’s annoying. So…
Are Hull lucky or good?
Exhibit H: Hull engineer – and rely upon – extreme efficiency and favourable game states rather than dominant control over the goalscoring chances in a match. Luck and opponent conversion COULD swing a large number of close games.
Scoring first matters. A 0-0 game is not the same as a 1-0 game. Hull have scored first 17 times, second only to Coventry. Once ahead, it suits their play style to absorb pressure, and inviting teams onto them is likely to inflate opponents’ xG. This is crucial in understanding why Hull’s xGA is high: they’re good at scoring first rather than always being lucky not to concede from the chances they give up (though sometimes they are).
It’s not unfair, however, to say Hull have had a good run of variance. They were the beneficiaries of two crucial penalty misses, both when they were 1-0 up, against Sheffield United and Wrexham. Had either been converted, the game state flips: Hull lose the lead (and two points), the opponent gains momentum, and the match becomes structurally different. These moments don’t show up cleanly in the league table.
The same applies to shots hitting the post. Hull’s opponents have struck the woodwork 10 times, which is the joint-most in the league. Several were at pivotal moments, including Gus Hamer’s effort for Sheffield United and Josh Sargent’s for Norwich, both at 0-0. Across the season, those near-misses plausibly account for multiple points.
Add discipline into the mix and the pattern deepens. No Championship team has seen an opposition player sent off more times this season, thereby tilting game states in their favour.
Taken together, these factors don’t mean Hull are just ‘lucky’. They signify that some of Hull’s results, some of the time, have been highly sensitive to variance. That sensitivity helps to explain why the underlying numbers continue to raise questions about sustainability. But it doesn’t mean to say that Hull are not good.
Predicting the future
Hull are good and they’re a little lucky, too. That’s the best of all worlds.
While their defensive profile likely rules out an automatic promotion push, the more relevant question is their prospects in the top six.
I fancy Hull, not on vibes, but on the data. I fancy them not just to hold onto a place in the top six, but to win the play-offs. Why? Because the numbers, allied with some harder-to-quantify qualities, point to three clear edges over the chasing pack.
Finishing – The ‘Lethal Trio’ show no sign of slowing down. Hull consistently create chances for McBurnie, Gelhardt and Joseph, who between them average 1.24 xG and 3.90 shots on target per 90. Those aren’t “nonsense” numbers; they’re the sustainable component of overperformance.
First goal – In each of the last three Championship seasons, at least four of the top six teams scored first in 24 or more matches. Scoring first is a marker of teams that know how to navigate the most difficult and important phase of a game: 0-0. If Hull continue to score first in around 60% of their matches, they’re on track to hit that benchmark again, and history suggests that matters.
(Play-off) Fit – Four of Hull’s six clean sheets have come in their last eight games. Jakirović has shown greater caution recently, but Hull’s comfort without the ball, and their temperament after conceding, point to a side well suited to the play-off format – tight, nervy games between sides of a more even quality.
Expected goals don’t decide seasons. League tables do. But it’s also plain speaking to say that Hull would be a far less dangerous proposition if the Lethal Trio suddenly lost form. That hasn’t happened. Instead, they’ve sustained their level across a long stretch of the season. So yes, Hull may lack the xG factor… but the X-factor? They’ve got it.
Fantastic this Sam. As a Tigers season ticket holder and someone that bores his mates with exG this has explained it and the interlationship with variance and/or luck, and logic, brilliantly
Excellent deep dive on the Lethal Trio overperformance. The distinction between luck and sustained skill matters more in playoffs where sample sizes are tiny. I'd add that Hull's high shot-on-target ratio (6th in league despite taking 6th-fewest shots) suggests process not just outcomes. The real risk isnt regression to mean but injury to any of those three strikers, which could expose the depth issue you hinted at.