Three Leagues and a few 'False' Positions
Today we're talking about EFL sides whose positions don’t quite add up.

Well, hello.
Our xG form guides for the EFL have been updated 👇

Words: Sam Parry
Two types of ‘false’ position…
The term can be either a sugary bit of flattery or a cold, cynical snipe. Hands up: I recognise that picking out false positions based on data alone offers an incomplete picture of what a football team is. And yet, like eating the last roast potato without offering it around first, it’s a sport I take great pleasure in.
This is a bit of fun, not damnation, nor eternal life. I’m going to present teams from each league whose underlying numbers contradict their league position, plus a few honourable mentions.
🔗 Championship
West Bromwich Albion
Over the course of the season, with the exception of Eric Ramsay’s short spell, West Brom’s numbers have been pretty consistent. The data paints a clear picture of their strengths and weaknesses: a) solid defence, b) tight games, c) don’t carve out a barrel load of chances.

Across the campaign, their matches rank as the second-lowest for Total xG (xG + xGA). They have the fourth-lowest xGA. And, given their bang-average xG, that leaves them with the 8th-best expected goal difference. Not bad. Certainly not 20th.
That was the case before Ramsay, and while there are differences between Ryan Mason and James Morrison, results have recently begun to align with that profile again.
With just one defeat in five and two wins on the bounce, they are not just reverting to type but improving upon it. For the most part, this hasn’t come against forgiving opposition, either: Oxford (L), Sheffield United (D), Southampton (D), Hull (W), Bristol City (W).
Morrison and his side may well have preferred a few more matches before the international break arrived.
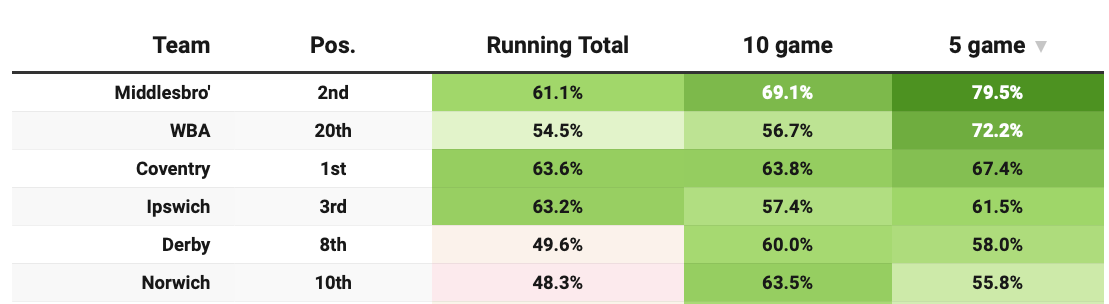
Honourable mention for Hull
All season, the underlying numbers have depicted Hull as a side with far blunter claws than results suggest. Their matches generate the highest xG total in the league, at 3.09, and across the season they have split that 43% to 57% with their opponents, while averaging 1.69 PPG.
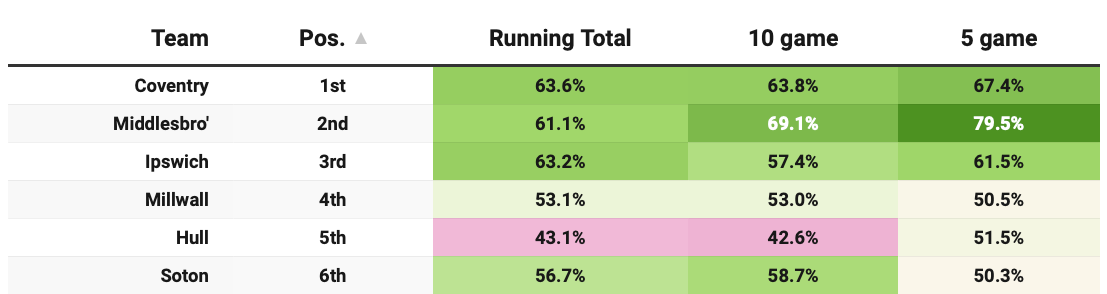
Interestingly, their share of chances has improved over the last five games, and that has brought… six points for 1.20 PPG (and one of their opponents was Sheffield Wednesday).
🔗 League One
Reading
It ain’t outrageous to see Reading in 8th. Of all the false positions, this is not the wildest.
However, when a team consistently gives up more chances than they create, that should ring alarm bells.
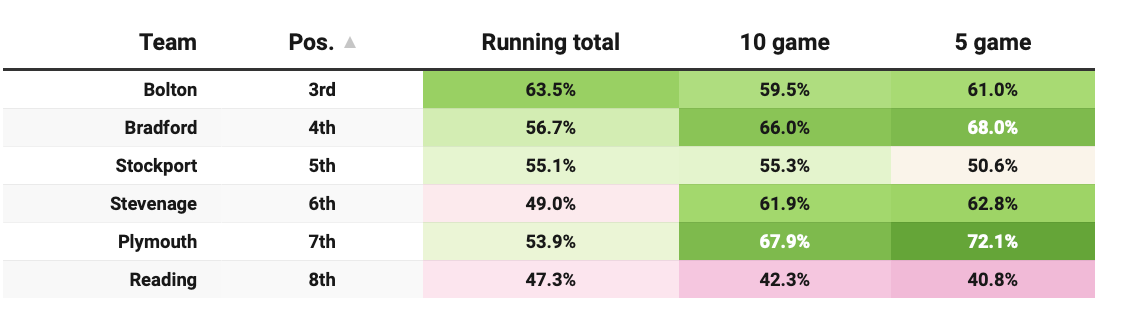
For Reading, that alarm has been snoozed. Over the last ten games they are around five percentage points down on their season xG share, and around seven points down over the last five.
The vibes around Leam Richardson since his appointment have not been particularly warm, and after registering no second-half shots against Stevenage on Saturday, sustaining a play-off push looks – from a performance POV – a bit of a stretch. That said, they only have the top two left to play, with the rest of their fixtures coming against sides outside the play-off places.
Honourable mention for Barnsley
A team in 13th can hardly be in a false position. The margins are fine and Barnsley are not extreme outliers. But they are worth flagging due to the impact of David McGoldrick (flying high) and Davis Keillor-Dunn (resting easy on the Wrexham bench), who have combined for 46% of their goals this season.

Given their rankings across these 5 key metrics, per Not The Top Tables, can you imagine what might be the case if they didn’t have Didzy?
15th - xG
19th - xGA
19th - xG share
20th - xGD
5th-highest xG Total
🔗 League Two
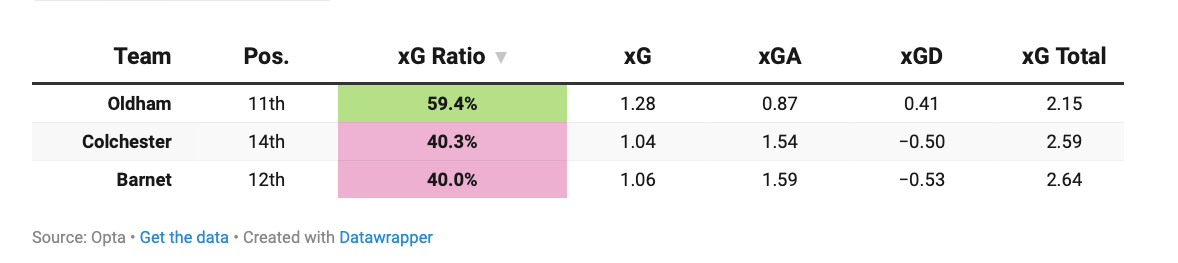
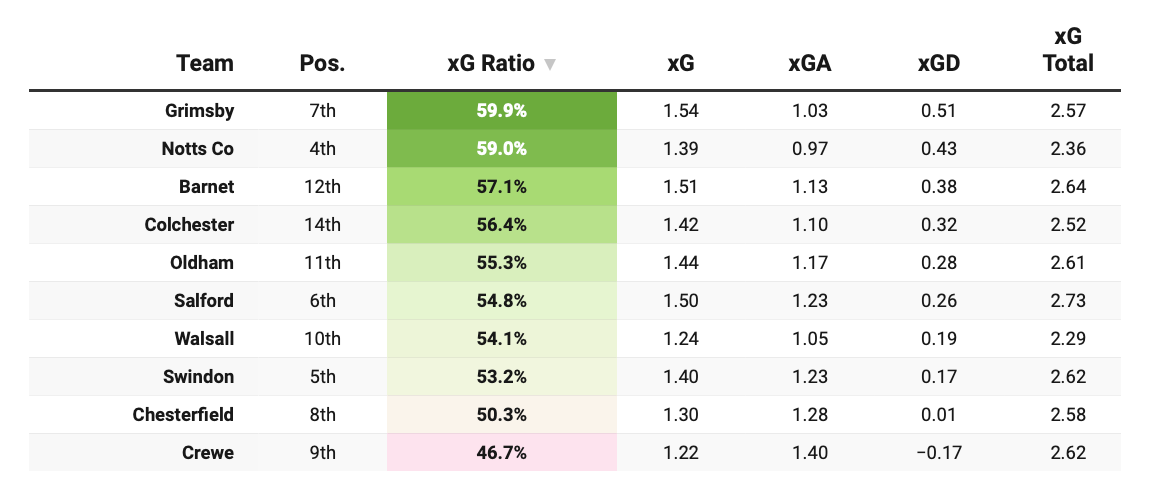
Barnet, Oldham, Colchester
The League Two table is telling a few porkies. With so little separating teams in the top half, that is no surprise.
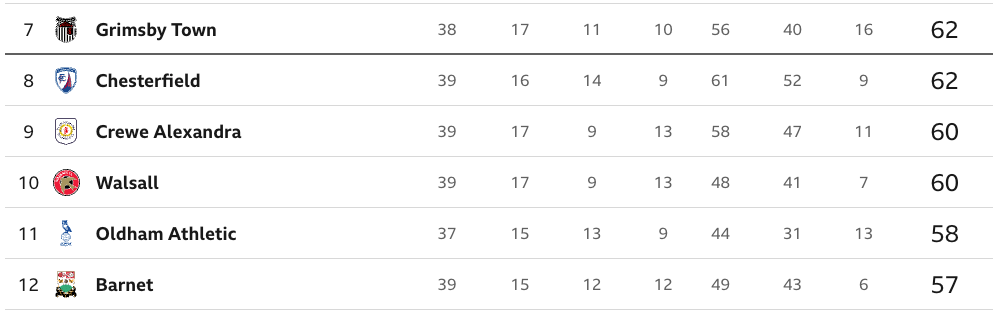
With 7/8/9 matches to go, fixture difficulty becomes more important as the games run out, and different teams have very different paths ahead. For that reason, Barnet, Oldham and Colchester don’t necessarily occupy false positions, but perhaps what-might-have-been positions.
Across the season, all three sit well (and rather similarly) when it comes to their share of expected goals. What is their share of REAL GOALS? Oldham have 58.7%, Colchester 54.9% and Barnet 53.3%.
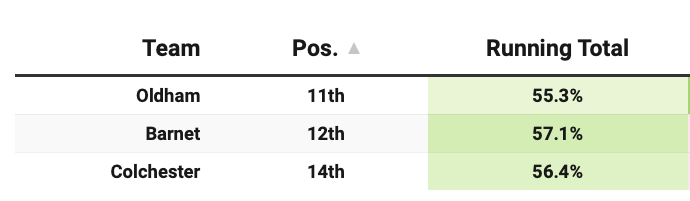
All of that augurs well. But the reality is that all three teams have had patches of average-to-poor results. Still, of the teams placed 4th to 10th, only Grimsby and Notts County have a better season-long xG share. All three suppress chances better than sides like Chesterfield, and all three create more than sides like Notts County.
For Colchester, down in 14th, it is very much a case of shoulda woulda coulda. For Barnet and particularly Oldham, who are hitting their best form, it may still be a case of shoulda woulda… could be?