Blades: oooh! Harrogate: aaaah! West Brom: chance of fireworks...
Jan 13, 2026
Well, hello. We’ve just updated every rung of NOT THE TOP TABLE, our xG form guides for the EFL.And this? This is an email that adds some colour and context to the numbers. It was written, this week, by Sam Parry.
Since cutting the ribbon on this data wing of NTT20, we’ve listened to a lot of feedback and learnt from our fair share of technical bugs – including the internet actually going down, twice!
So, a quick parish notice as we relaunch the best (and possibly the only) xG form tables for all three EFL leagues. YOU WON’T BELIEVE THE DIFFERENCE THESE 10 TWEAKS WILL MAKE TO YOUR TUESDAY ROUTINE!!!!
Each league now has a fixed and dedicated page;
The tables will be updated on Tuesdays, and we will let you know by email when that happens;
The email in question (“Who’s eating…”) will be a write-up of the most eye-catching data points, teeming with hard-nosed information and soft-boiled gags;
You don’t need to know this but the reason for 3. is because we found Gremlins in the system where the email-version of the tables differed to the browser-version, and we refuse to water those Gremlins any longer, nor feed them after midnight, or at any time;
I digress…
We’ve now added league positions to each of the tables (thanks for those suggestions);
We’ve also added a table comparing xG share across timeframes;
Some, but not all, of this content is now behind a paywall;
We’re eternally grateful to Eamonn Geoghegan for pulling the data together, and to you for reading;
On what charge? For eating a league? A succulent EFL league?
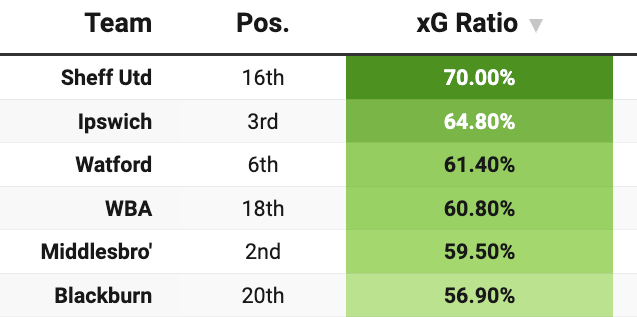
Over the last 10 games, no team has accrued more points than Sheffield United (22). In that run, they’ve claimed a 70% share of total xG, gone unbeaten at home (W4 D1) and scored 25 goals.
For all of that, they are 16th.
This is Championship manifest.
🦊 HUNGRY: Leicester City
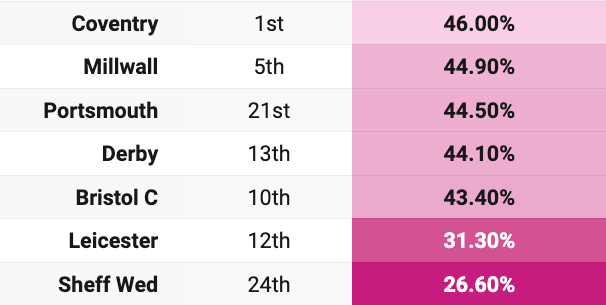
Leicester’s xG ratio over the last five fixtures (34.3%) is better than Sheffield Wednesday’s – and that’s it. Nobody else’s.
Zooming out, the Foxes’ season-long xG share in our Running Totals sits at 43.70%. That’s within 1% of Oxford (23rd), Norwich (22nd) and Portsmouth (21st). The point being: this isn’t noise. The trend has been heading south for a while.
Sick as a fox they are. (It’s a type of dog.)
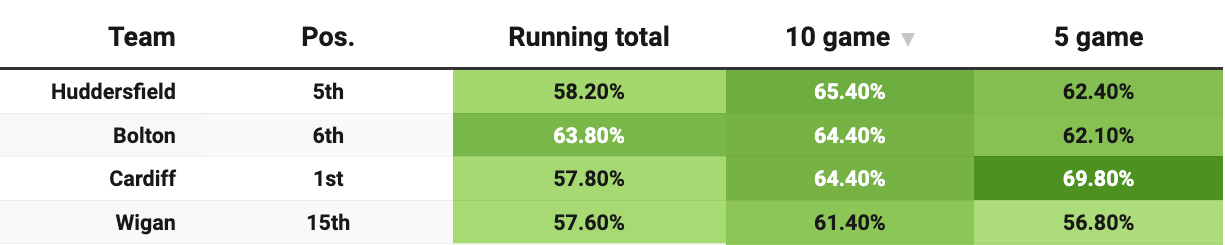
🥴 AMUSING THE BOUCHE: West Bromwich Albion
West Brom parted company with Ryan Mason after a 2–1 defeat to… Leicester. ‘Twas a Fatawu stunner wot won it.
Now, the decision may be fair enough. Mason may not have shaken enough biros and felt tips out of the Baggies’ bag, and the new man may yet turn them into a fresh set of gel pens. But. But. But. But.
West Brom have the third-highest xG ratio over the last five games and the fourth-highest over the last 10. Mason was sacked after taking nine points from those 10 games, but given the underlying numbers, this might be a belter of a job for Eric Ramsay to bag.
Terriers, eh? We’re in sick dog territory again, but the ameliorative kind.
Lee Grant’s side have the third-best xG and second-best xG ratio over the last 5 games. Over 10, they have the second-highest xG, the second-lowest xGA and – naturally enough – the best xG ratio.
They’ve taken only 14 points from those 10 games, winning three, drawing five and losing two. Will the PPG start catching up with the numbers? Let’s throw them a stick and watch…
📉 HUNGRY: Northampton Town
Cast your mind back to 1st December, when Cobblers were 14th with 23 points from 17 games. Now stop casting your mind.
Northampton have given up a 70% share of xG in their last five games. The equation: 0.73 xG and 1.70 xGA. By my maths, that’s almost a whole expected goal of difference per game.
They’ve gone W1 D2 L2 over five games (not bad), have added just six points since 1st December (quite bad), and are two points off the drop zone (bad). Their opponents in those seven games did include a rapidly rising Peterborough as well as sides currently occupying 5th, 4th, 6th and 5th again, but things still look rough. And you thought the dog puns were over!
🥧 LESS PASTY: Plymouth Argyle
As in, less beige, less blanched, rather than some dietary advice about Devon’s second-most famous export. (Second-most famous after…? Have a swing.*)
The colour hasn’t fully returned to Tom Cleverley’s cheeks after a challenging start to life at Plymouth, but it’s certainly made an appointment. Our xG comparison table, pictured above, shows their improvement over time – 55%ish is solidly top-10 levels.
That run saw them go W2 D2 L1. Argyle remain closer to the bottom four than they are to the top 6, or even the top 10, but we’ve seen how a little run can go a long way.
Yeah, yeah, the top club is looking strong. So what?
A quick swizz at our xG Ratio Comparison Tables shows that Bromley’s 5- and 10-game form is better than their season average. So, not only are they good, which we knew, but they are good and improving. Their ascent to the top of the table is not, it seems, built on variance’s fair hand but on a genuine improvement in performances.
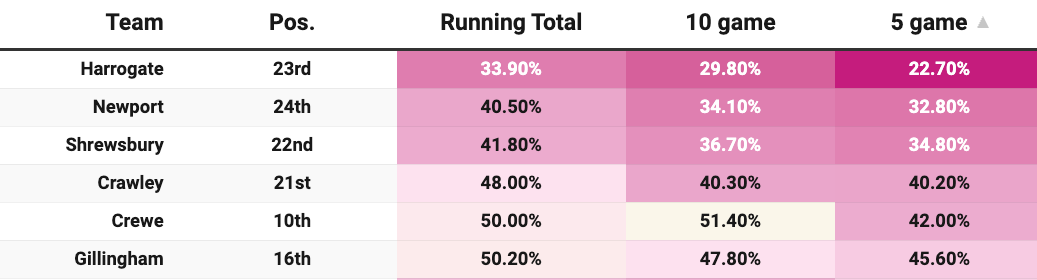
⛔ HUNGRY: Harrogate Town
Thanks to an added-time equaliser last time out, Harrogate are no longer bottom of the League Two table. They are bottom of our 5-game form table though, with a share of less than 25% of the total xG in those games. And in that time they scored just one goal – that added-time equaliser.
In fact, one goal for a share of 22.70% xG may well be an overperformance. Makes you think. Well, only for a second. Simon Weaver’s side have taken 7 points at home all season and they’ve got 7 points fewer (18) than at the same stage last year (25). Troubling.
🌡️ DROP IT LIKE IT’S HOT: Crewe Alexandra
This reference doesn’t quite work, because Crewe have cooled over their last five games. Perhaps they’re dropping like coal (hot) in snow (cold)? Apt for a railway town.
The season-long numbers have them chugging along around the 50% mark for xG share. But the drop-off over the last 5, with all due caveats for a small sample size, is quite stark.
Lee Bell’s side have won just once in five games, haven’t scored an away goal in that time, and threw away a lead in added time last time out to… yep, Harrogate.
That’s all for this week. Do have a play around with the tables; they’re all sortable and customisable. Handily, they have a whiff of the corporate spreadsheet about them, so you can spend as much time as you want looking at the 7th-placed team in League Two and their surprisingly bad underlying numbers without fear of reprisal from THE MAN.


What a chuckle-filled jaunt through the xG tables, nice one Sam, big fan of your work.
This is great, really enjoyable and digestible (sorry, dreadful pun!)