Last week, Adrian Chiles wrote a Guardian column titled, “I’ve been thinking a lot about dog poo.”
Replace “dog poo” with Wrexham, Hull, Coventry, Argyle, Stevenage, Huddersfield, Colchester, Crawley and Barrow, and we’ve been thinking along very similar lines.
On the face of it, Wrexham’s 12 points from five games looks like lift-off whilst 15 points from 10 does not. But, over both timeframes, the xG backs up a general improvement.
Wrexham’s season-long xG ratio dips below the 50% mark, but across our 10-game and 5-game tables there’s a clear uptick. There is noise. But it’s sweet, sweet music.
Team | Position | xG Share Running Total | 10 game | 5 game
🐅 FAMINE: Hull City
There’s no getting away from it: the Tigers remain the Championship’s great data outliers. Their xG share is:
2nd-worst overall
5th-worst over 10 games
3rd-worst over 5 games
You blinking well enjoy it, because:
PPG over 5 games: 5th-best
PPG over 10 games: 4th-best
Season-long PPG (AKA THE LEAGUE TABLE): 5th-best
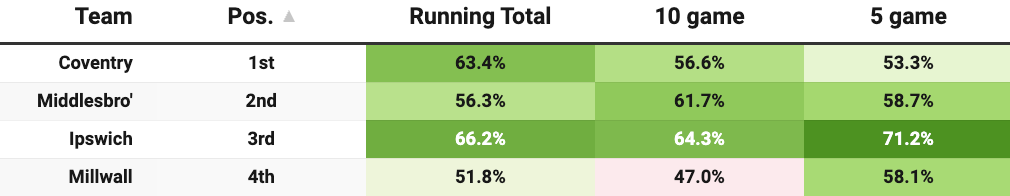
🌥️ PICKY BITS : Coventry City
Blue-sky thinking allows creativity without constraint. Sky Blue thinking, right now, is about recognising that Coventry’s creativity has been constrained recently – just not by very much.
Running at 1.5 PPG over the last ten games, Frank Lampard’s side have still posted a greater share of xG in seven of those ten. They’re simply a touch less dominant. A tad easier to play through.
You could call this regression to the mean: Coventry were always likely to dip from an extremely high base. Or you could be mean: Middlesbrough and Ipswich are outperforming their season-long underlying numbers, Coventry are not, and suddenly the title race is ONNNNNN.
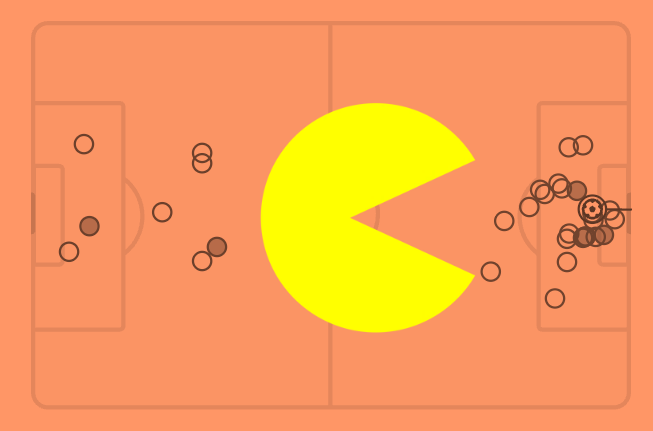
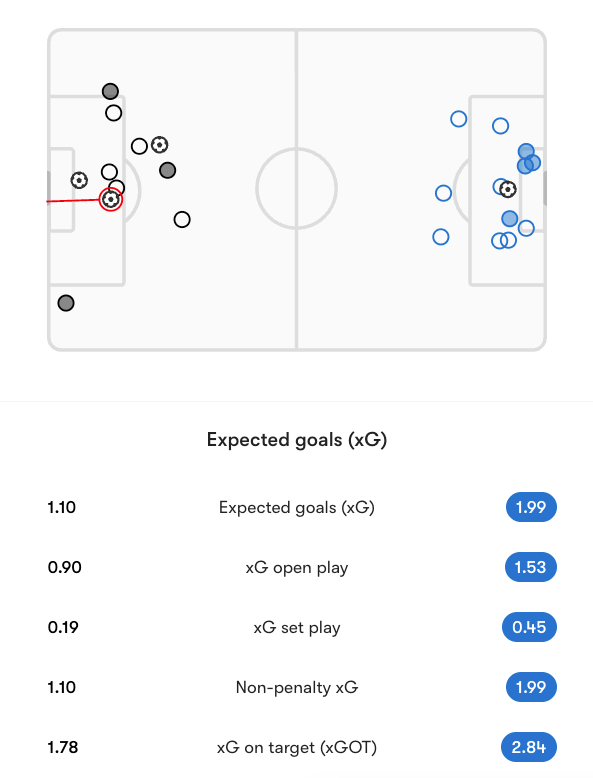
We suggested last week that the colour might be returning to Argyle’s cheeks. Nothing quite lifts the spirits – or eats the ghosts – like… a 1–0 win?
This was arguably the single best performance under Tom Cleverley. Argyle racked up a mammoth 4.04 xG against Peterborough United’s 0.19, meaning they’re now averaging 2.00+ xG per game across their last five.
Posh (0.19) 0-1 Argyle (4.04 xG) - FotMob
Yes, it’s one game. Caveats to the left of them. Caveats to the right of them. Small sample sizes in front of them. But it’s rare to see a team concede first (within 23 minutes, in fact) and for game state never to meaningfully shift away from the side in the lead. That’s fun. Keep an eye.
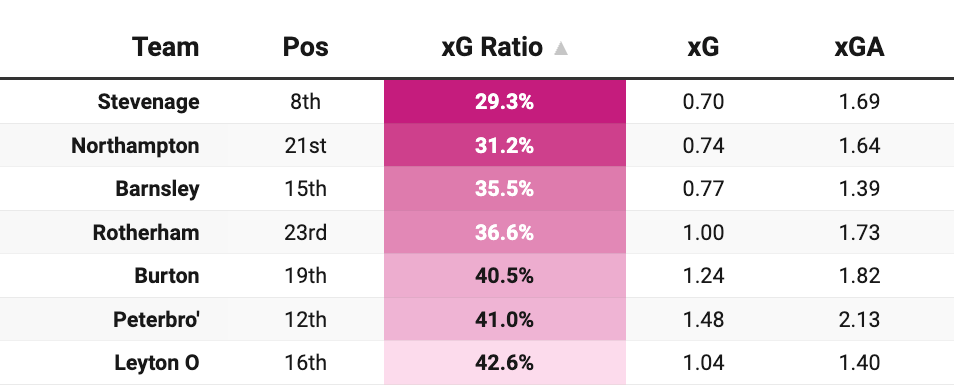
⬇️ FAMINE: Stevenage
Stevenage have taken two points from their last five matches.
In that run, they’ve posted the lowest xG in the league (0.70) while allowing 1.69 xG per game at the other end. Their xGD over 10 games is -0.63 per game. Season-long xGD? It’s -0.36 per game.
We might need to dust off the false-position klaxon for the side in 8th.
🤎 Miss-his-xG Mud Pie?: Huddersfield Town
A little managerial wrinkle.
We flagged last week that the Terriers’ results weren’t marrying up neatly with the underlying numbers. Like Will Still and Ryan Mason before him, Lee Grant was sacked after posting an xG share that, per our tables, had Huddersfield high on all timeframes.
Here’s the straw that broke the camel’s (owner Kevin Nagle’s) back…
The big shift is defensive – or rather, the chances they aren’t giving away. They’re 9th in the table. The data says keep watch for the “Tick. Tick. Boom.”
📉 FAMINE: Crawley Town
Crawley have spent their January building a new squad (they’ve signed 10 players already). But as each game and every poor performance goes by, they are running out of track.
There are enough games remaining to turn it around. But per our tables, what’s most concerning right now is that the underlying numbers are getting worse, not better. They are conceding more chances, not fewer. They are creating less, not more.
🫖 High Tea: Barrow
Barrow’s games are providing us with a hot, steamy mug of chances.
Their season-long numbers show games averaging around the 2.70 xG total mark. In their last 5 games, it’s up to 3.52. They’ve only picked up 3 points in that time – W1 L4 – but perhaps new-signing Danny Rose will shoot some hoops if they continue to play out basketball games.
Brilliant breakdown of the xG splits. Hull as a data outlier is facinating because it challenges how much weight we put on underlying stats, dunno if sustainable luck is the right framing tho. Watched a freind get burned betting against Hull all season thinking regression had to come. The discrepancy between process and results there might say more about converting high quality chances than just variance alone.
Thank you guys for such a useful resource! Just one small request...is there any chance you could number each table 1-24, so that I can see where a particular team ranks without having to count from the top or bottom?