We’re entering the glitch. Not because Alex Neil’s side have claimed 10 points from their last 5 games (W3 D1 L1), but because their underlying numbers over that period show an uncharacteristic 2.03 xG per game, for an xG ratio of 65% (for context their average xG over the season is 1.37).
The return of key players from injury has helped. But what has sent those numbers right into the Matrix is an aptitude for getting into good positions. Their frequency of touches in the box over the last 5? It’s 29, 31, 19, 26, 59(!) for an average of 32.8.
I’ll take the Mill pill, Mr Morpheus.
🤕 HANGRY: Blackburn
Back in the real world, Valérien Ismaël has been spitting truths about Blackburn’s situation: "The reality for us is we're missing 13 players and [in] the long run we are feeling it.” Don’t forget the short run Val…
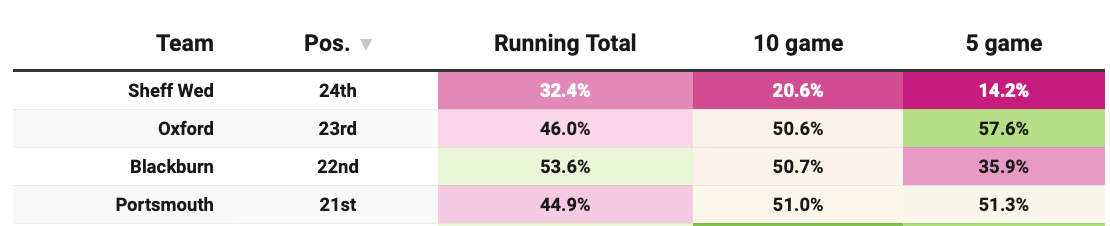
Over the last 5, they’ve lost 3 and drawn twice. They’ve only won once in 10. And per our comparison tables their 17.7 drop off in xG share % (from season-long to 5-game) is the starkest around, bar Sheffield Wednesday.
Yellows have played 5 times since Gary Rowett was sacked just before Christmas. In that time, including three unbeaten games under new boss Matt Bloomfield (W1 D2), their xG share has jumped 11.6 from 46.0% to 57.6%.
That comes down to the chances they’re giving away, or more accurately, that they are not. Oxford have given up 0 big chances under Bloomfield; their xGA over the season is 1.25 but over the last five we’re looking at 0.80 xG. Their chance creation remains a little thinner, more custard than mustard, but we’ll be keeping an eye on a tough next five to see whether they can keep cutting it against Birmingham (H), Sheffield United (A), Coventry (A), Norwich (H), and Middlesbrough (A).
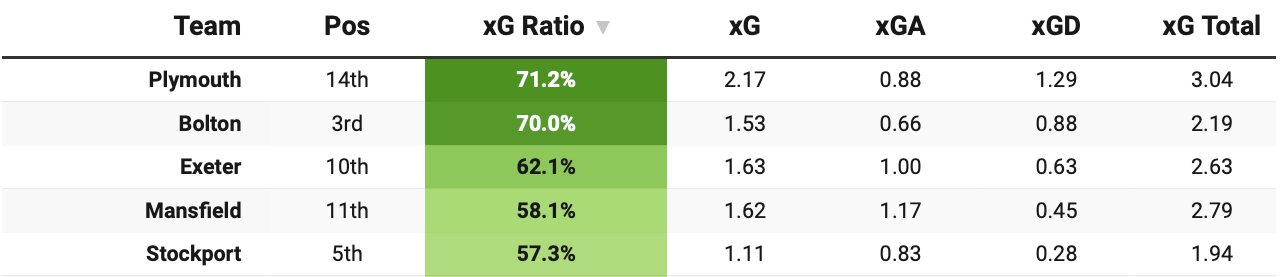
We can’t keep banging on about the Argylaissance, no matter the eye-popping metrics over their last five games… xG (2.17) and xGA (0.88).
But there’s interest just an hour’s drive down the A38 where, with a 5-game spread on the table, Exeter pick up a plate. The Grecians, fair to say, have been filling their pitta with a bitta fun.
Gary Caldwell’s side have picked up 13 points from their last 5 games: Port Vale (W), Stevenage (W), Huddersfield (D), Luton (W), Wimbledon (W). Their away form is better over their last 3 than it was over the 11 before. Their home PPG (1.92) is the sixth best in the league, and with all that’s going on behind the scenes, you’ve got to find a bit of joy in that.
Over the season, they’re running a shade under 50% xG share (1.14 xG v 1.17 xGA). That 1.17 xGA figure is comfortably top half, and whilst we’ve seen minor improvements to it over both 5- and 10-game tables, it’s their chance creation that has improved the most: 1.63 xG (5 game) and 1.32 (10 game)
⬇️ Feeders: Peterborough
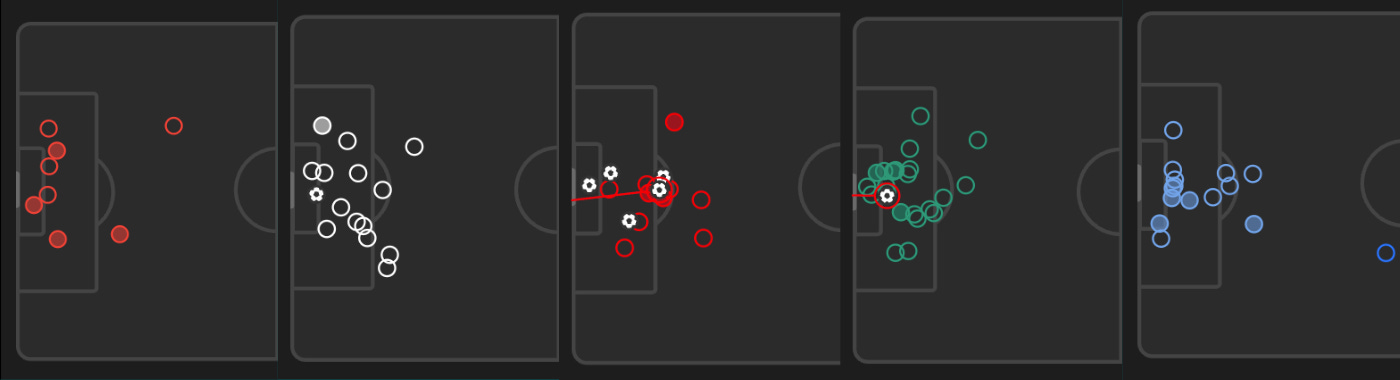
Posh are feeders. Over the last five games, Luke Williams’ side have seen a per-90 xG Total of 3.86, and no team has given up better chances to their opposition in that time (2.36 xGA).
Yes, the 4.04 xGA against Argyle makes this number noisy. However, they’ve still posted 2+ xGA in 3 out of 5 of those games. Good attacking numbers mean this matters a little less than it might — they’ve won 3 out of 5 — but there’s surely a ‘best practice’ manual somewhere that says conceding this many chances is a recipe you don’t want to cook up.
Shots against vs Rotherham, Bolton, Lincoln, Argyle, & Wycombe - FotMob
⁉️ MINT IMP-ERIAL: Lincoln City
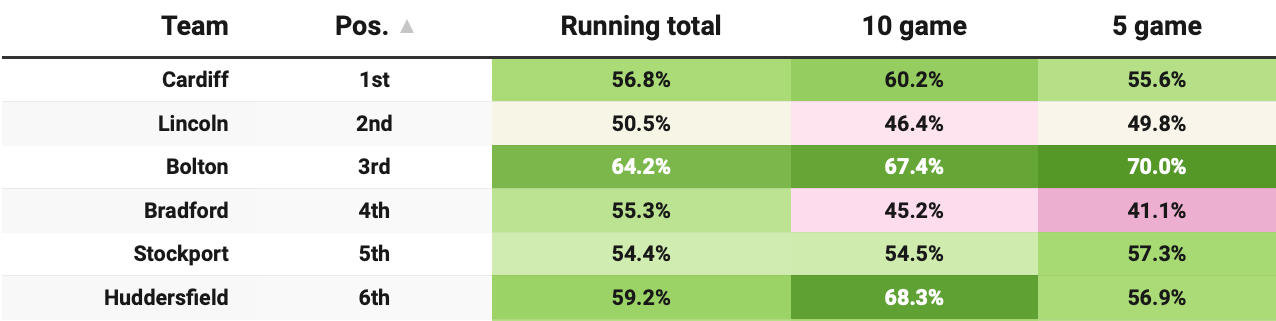
Imps’ xG share over the season is looking less than minty. Cause for humbug?
Across our 5-, 10- and season-long tables, Michael Skubala’s side carry the worst xGA of any team in the top six. Their xGD is the lowest of the group, and they’re only just scraping a 50% share of the expected goals.
Is that explicable by game state? It’s something to consider.
No EFL side has taken the lead more often (18 times), nor held it for longer (46.6% of minutes), than Lincoln City. Score early and opponents are forced into aggression. Score early and you have cause to sit off. Both statements may be true, but it’ll be interesting to see if variance might give Imps a limp soon.
If Karl Robinson is overseeing a streak then it’s a good one.
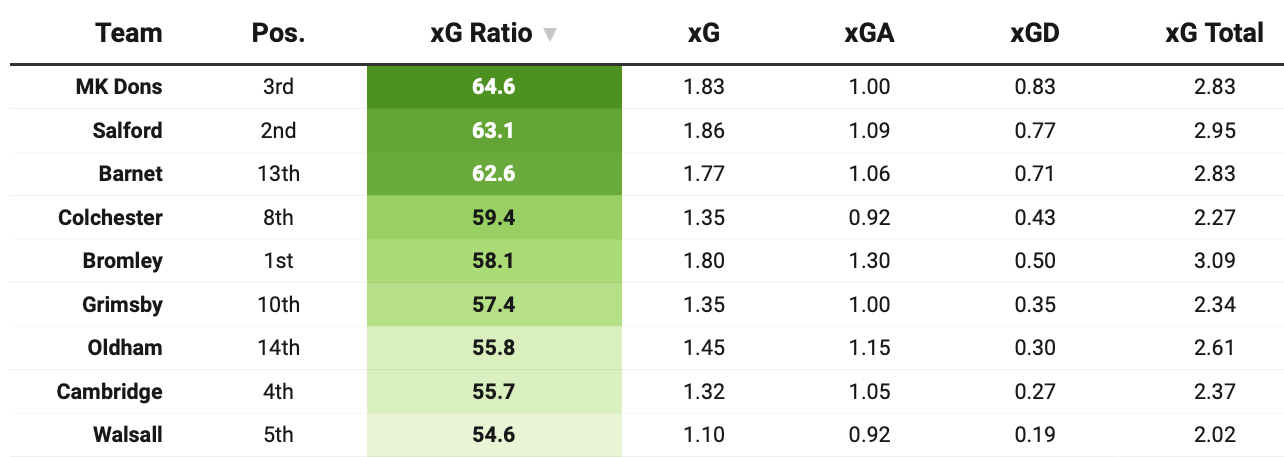
Salford are 1st in our 5-game form table (69.3% xG share), and 2nd in our 10-game form table (64.6 xG share) where their 1.90 xG cannot be bettered. They’ve had the lion’s share of chances against opponents in that time and it’s translated into 23 points from their last 10 games, and 13 from 5. Good going.
If there’s a wrinkle, it’s that a good chunk of top teams in League Two are bang at it as well….
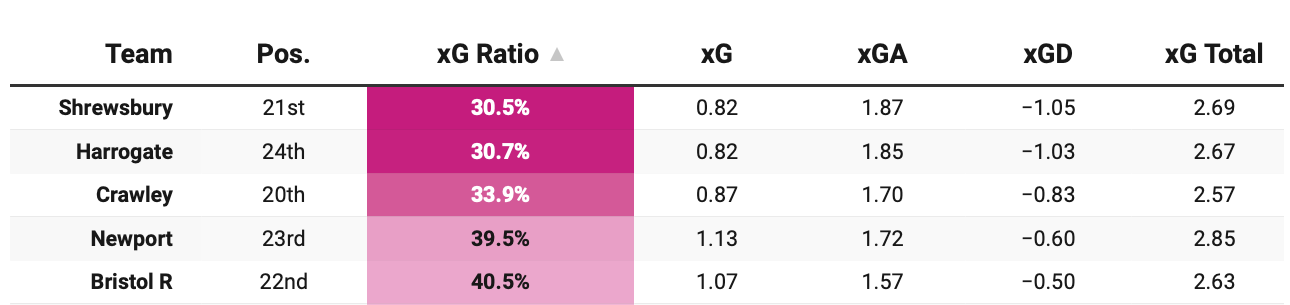
Bottom of the 5-game xG form table, Shrewsbury have had season-long issues with creating chances. Going W1 L4 over that period, their xG (0.82 per 90) is fairly consistent with their results: 1-5, 1-0, 0-3, 0-1, 1-3.
By my count, they’ve taken 16 shots on target in those 5 games and just 31 on target over 10 games, which is totally consistent with their season long numbers of 3.04 SoT per 90 (Opta). It’s a pattern and not a good one.
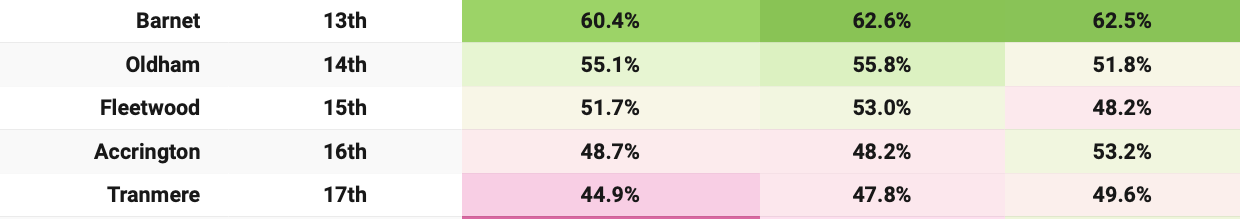
⚖️ Weighing up: Fleetwood Town
Pete Wild was sacked over the weekend after a five-game run of four defeats and one draw. All narrow stuff: 1-0s, 2-1s, and a 0-0.
Dig a little deeper and Fleetwood’s numbers scream bang average, not terrifying. Season-long, 10-game, even five-game trends all paint a picture of a side competing. Goals for and against sit level at 34-34, and only twice all season have they lost by more than a single goal.
This hasn’t been a team getting blown away — it’s been a team living (and losing) on very fine margins. And that was, rightly or wrongly, deemed a sackable offence.
Really digging the Millwall Matrix callout! The 59 touches in the box is absolutely bonkers compared to their season average. Makes me think about how much we rely on averages when individual game variance can be that extreme. I covered a youth soccer tourament once where a teams touch-in-box stats spiked similarly, turnout their opponent was playing super high line. Context matters so much with these metrics imo.


Really digging the Millwall Matrix callout! The 59 touches in the box is absolutely bonkers compared to their season average. Makes me think about how much we rely on averages when individual game variance can be that extreme. I covered a youth soccer tourament once where a teams touch-in-box stats spiked similarly, turnout their opponent was playing super high line. Context matters so much with these metrics imo.