The “play-off chasing pack” has to end somewhere. Wherever you draw the line, Chris Davies’ side are above it.
Birmingham’s numbers are trending strongly and they look well placed for a push. In taking 11 points from 5 games (against Swansea, Sheffield Wednesday, Stoke, Oxford and Leicester), they’ve seized the chance to make hay during a kind run.
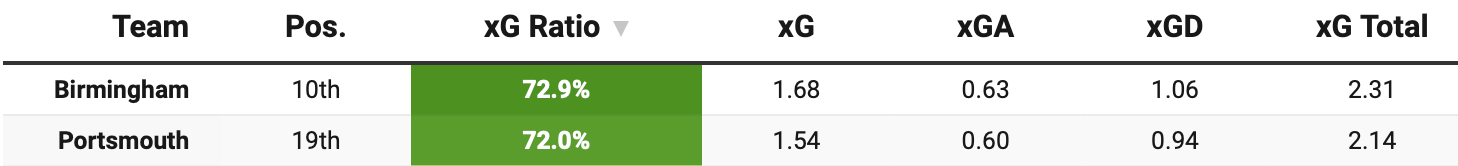
Across those five games, Blues posted a huge 72.9% share of the xG, the highest in the Championship over that span. Over the last 10, they rank 6th with a 58.4% share.
Sterner tests await. West Brom at home tonight is followed by trips to a resurgent Norwich and a resolute Millwall, before Birmingham welcome a resplendent Middlesbrough and then a Charlton side fighting for survival.
After a heap of eye-catching January signings that should raise their level, are Birmingham the biggest runner in the pack?
⛴️ STARVING (THE OPPOSITION): Portsmouth
Not far behind Birmingham over five games, not far at all, Pompey have laid siege on opposition goals while starving their last five opponents of chances.
John Mousinho’s side have posted a 72.0% xG share and allowed just 0.60 xG per 90 in that time. This feels like more than noise. Over the last 10 games, Pompey’s xGA of 0.75 per 90 is unmatched by any other side in the Championship. While their league position remains precarious, they look like a team ready to cruise out of trouble.
⭕ STARVING (NO REALLY THIS TIME): Preston
Oh Heck!
Preston’s four points from five games (0.8 points per game) and 12 points from 10 (1.20 ppg) mark a clear drop-off from their season-long output. They sit 7th with 47 points from 31 games, averaging 1.52 ppg.
It’s a dip that’s reflected in both the 5- and 10-match form tables. Their underlying numbers, particularly defensively, tell the story. An xGA of 1.47 over 10 games and 2.01 over five speaks to a worrying slide. Season-long numbers were never especially bright, and while no side is closer to sixth, the play-offs somehow feel more distant than they have all season.
No EFL landmass has a greater number of teams in need of revival than South Yorkshire this season. Blades, Owls, Rotherham, Donny – hell, even Barnsley are only five points above the relegation zone.
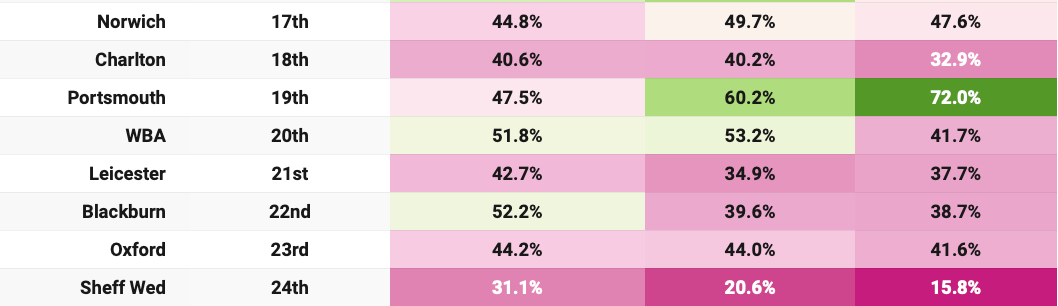
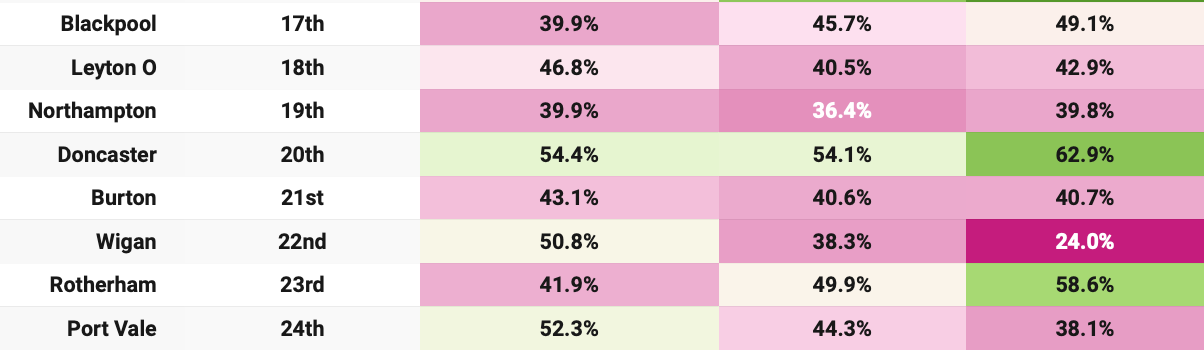
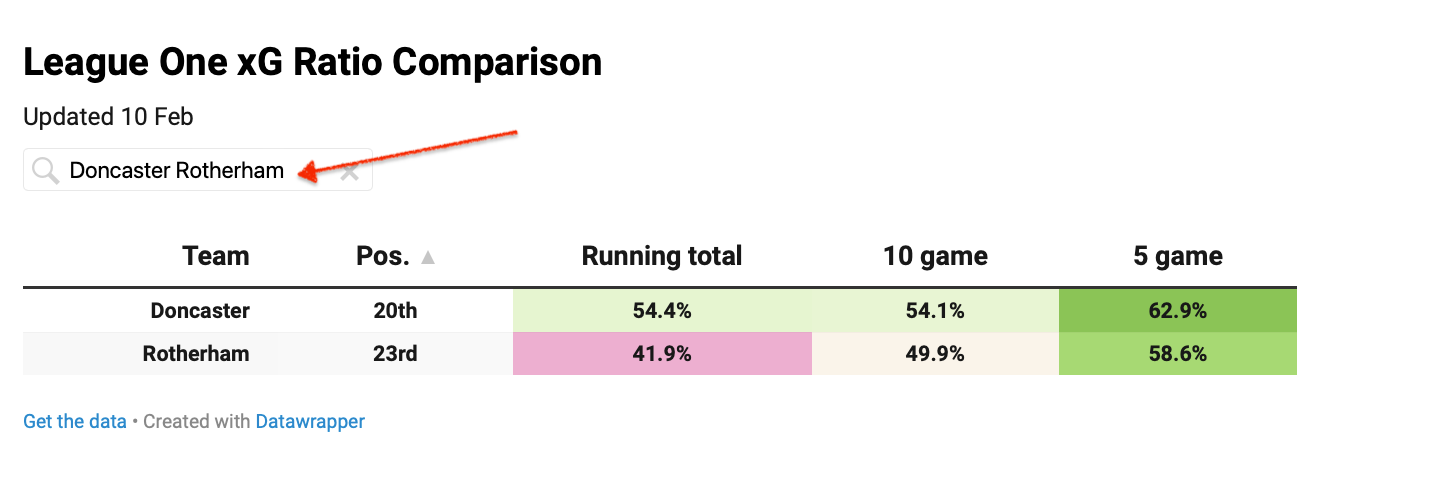
For Doncaster and Rotherham, that revival means getting their heads above the dotted line, and both are making a better fist of it lately.
Doncaster’s numbers have been consistent all season, but the last five have come with an extra kick. They have averaged a noisy but pleasing 2.04 xG per game across that spell, returning W3 L2. That is around +0.6 xG above their season average. With Elliot Lee added in January, that extra firepower could help convert more of those chances.
You can search on all tables to compare two or more teams
Rotherham’s improvement is even starker. Across the season, they hover around 1.06 xG per 90. Over the last five games, that rises to 1.68, and across 10 it sits at 1.39. A significant improvement.
Oh, and they’ll be able to pit those improvements against one another next week, on the 21st.
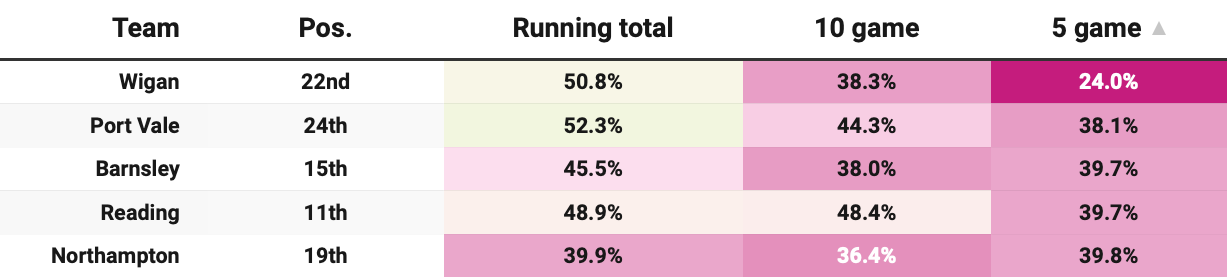
🥧 HUNGRY: Wigan
This is only our fifth missive on NTT20.COM’s form tables but regular readers will know that, in the wake of managerial sackings, I have often pointed to decent underlying numbers despite OK or poor results.
I am not going to make that case for Ryan Lowe, who departed Wigan after one point from five games, five points from 10, and numbers like these.
🥃 Limoncello? Shots? Yeah… shots: Stevenage
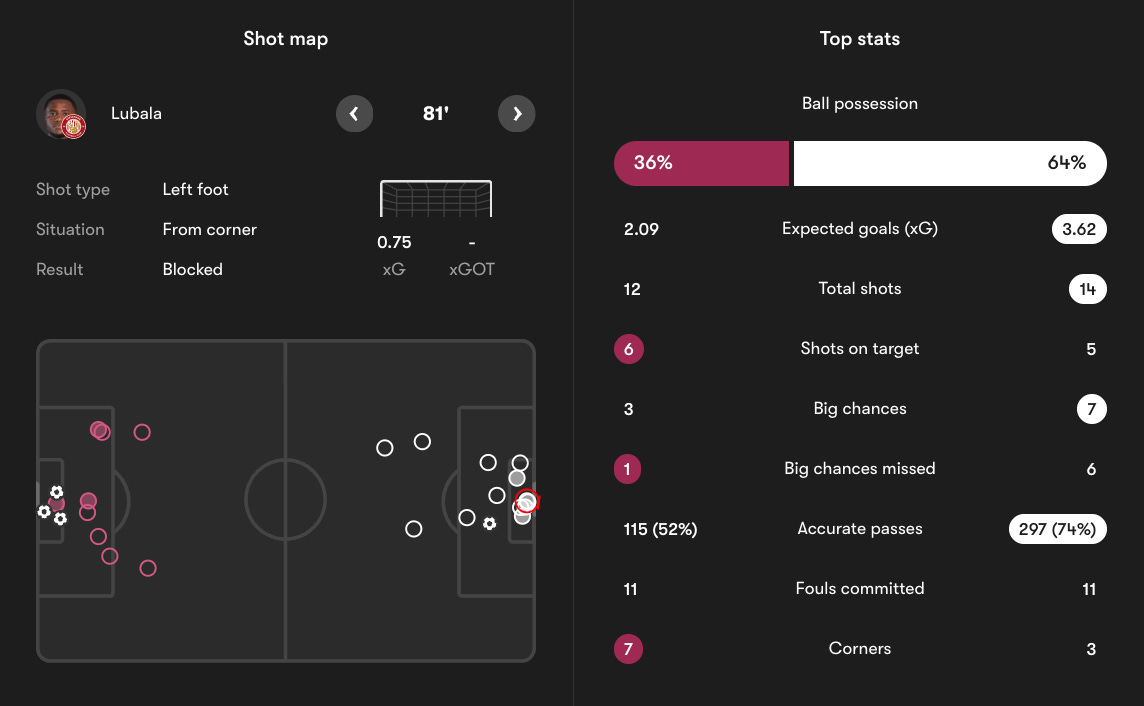
Scan the five-game xG form tables in League One and the eagle-eyed among you may spot the thumbprints of a gerrymanderer.
Source: FotMob
Last weekend, Stevenage had a wild 81st minute against Northampton. In the space of a few seconds, they took six shots with individual xG measured at 0.04, 0.19, 0.38, 0.71, 0.78 and 0.30. That adds up to an xG of 2.4. Two point four goals.
You are the ref analyst. What happened next?
Stevenage did not score. Even if they had, we felt that 2.4 xG for a sequence of six shots was excessive – you can, after all, score a maximum of one goal in one passage of play. So, we rounded down that passage to 0.99 xG when looking at the match as a whole. The overall total for Stevenage therefore stands at 1.85 xG.
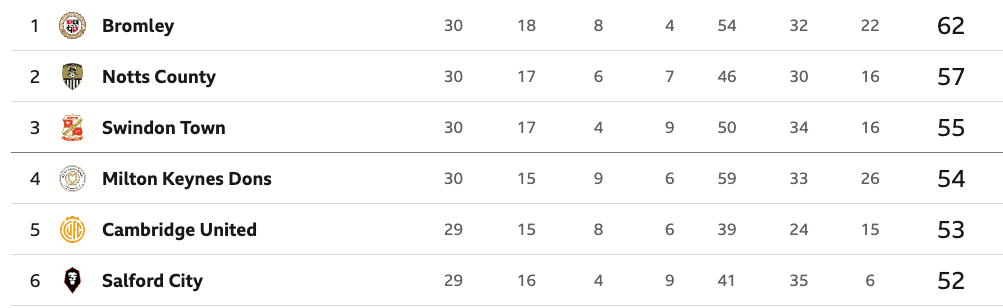
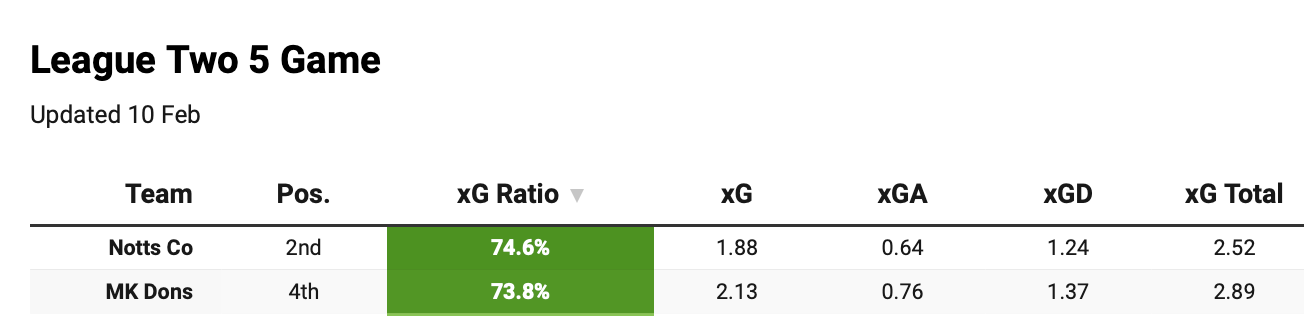
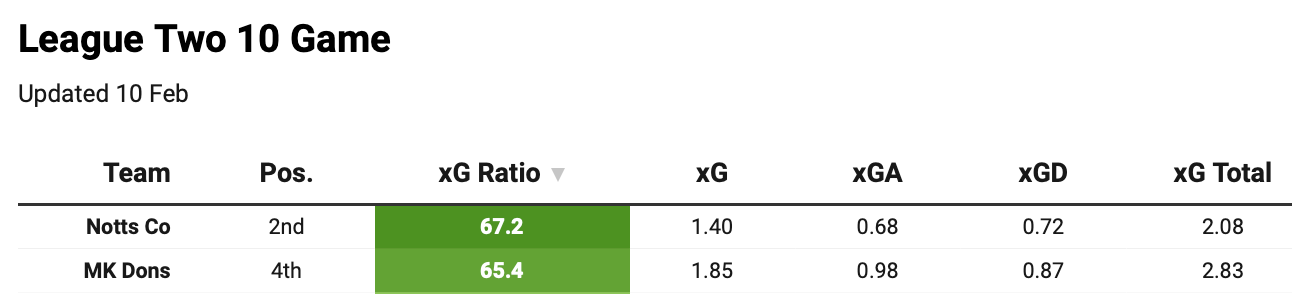
Two flyers to finish, and it’s Notts County with top billing in League Two for the second week running.
They lead the league for xG ratio across both the last five and last 10 games, and their xG share in that time — 74.6% over 5 and 67.2% over 10 – is so greedy that, at this point, you have to wonder if a wafer-thin mint might explode something.
Hold up, though! There’s team on their shoulder in points and underlying numbers alike. In fact, you could argue they’re a nose, or a bellybutton, in front.
🤏 A WAFER-THIN MINT LESS THAN NOTTS: MK Dons
We’re in wafer-thin margin territory here. But MK arguably look like the pick of the pack and certainly, in comparison to Notts, the most wolflike. And that’s fun…
BBC
Who’d have thought MK under Warne would be the ravenous chance creators? Who’d have thought County would be the great cutter-outters of chances?
But it is MK who are carving out opportunity after opportunity, posting the highest xG across both five- and 10-game spells. County, by contrast, are starving opponents, recording the lowest xGA over the same periods.
Over the last 10 games, MK are averaging 2.10 points per game, with County just behind on 2.00. It’s Bromley v County at the weekend and MK, with a win, will make ground somewhere.