League Two xG deep-dive and predictions
We've fired up the projection spreadsheet - who's cooked and who's cooking?

Well, hello.
Our xG form guides for the EFL have been updated 👇

Words: Sam Parry
“Look fourth!”
Someone important said it in a Psalm. And I don’t know about you, but with leagues like these, I’m inclined to follow the instructions. Where else would you look, but the fourth tier?
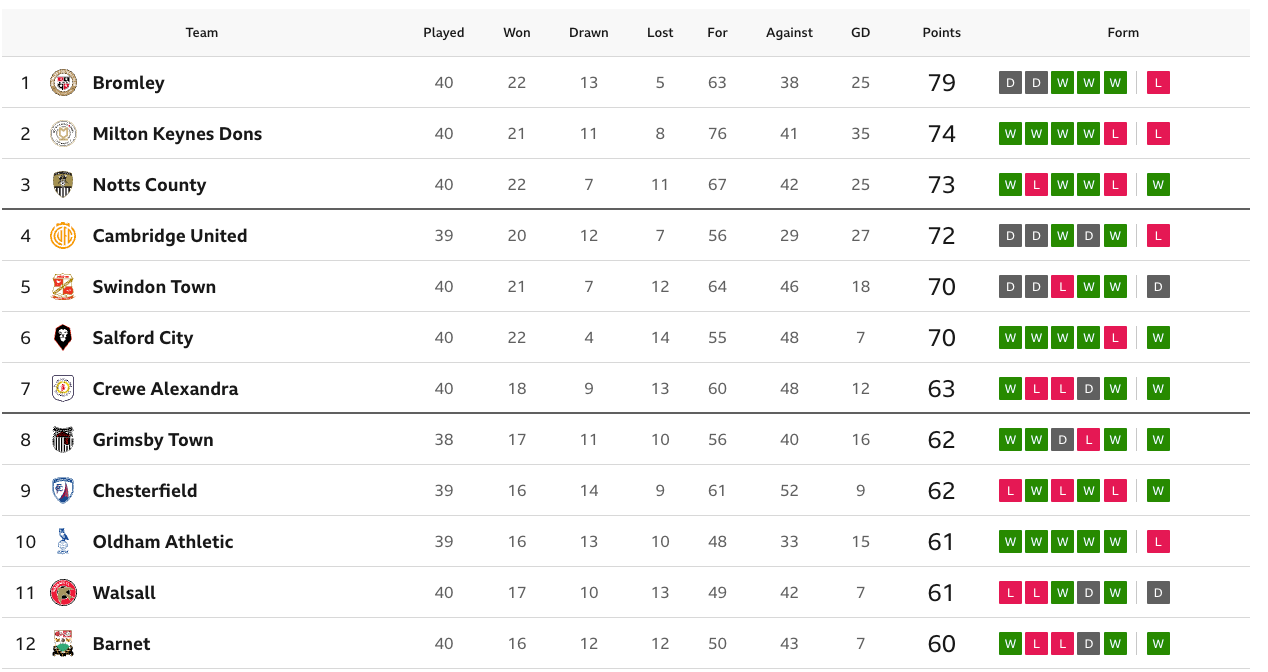
Here’s a league where every top-half club except Bromley is, at most, three points away from an entirely different situation – automatics to play-offs, play-offs to automatics, play-offs to nada, and nada to play-offs.
It deserves some special treatment. So, using the same hulking spreadsheet as The Pinsticker’s Guide to the League Two Run-in, I have placed the latest xG figures, PPG form and remaining fixtures into the hopper and cranked the handle. Here is what the machine has spat out, ordered by final predicted position and presented with a bit of context.
🔗 League Two
Bromley
• PPG: 1.98
• Fixtures: 6 (3H / 3A)
• Remaining opponents PPG: 1.52
• Points projection: 90.4
• Position: 1st (-)
In a league more finely poised than a hot iron skating over very thin ice, our model reckons that the team who won’t budge is Bromley. That makes a lot of sense: they have the points on the board.
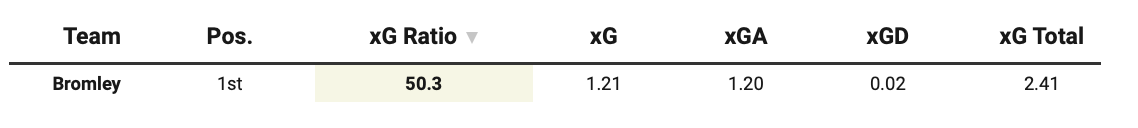
They did, however, just lose to Barrow. Their 10-game xG ratio paints a picture of incredibly even games. Andy Woodman’s side have won their share of those over the course of the season, but they are somewhat clinging to top spot rather than sprinting for the finish line.
MK Dons
• PPG: 1.85
• Fixtures: 6 (3H / 3A)
• Remaining opponents PPG: 1.44
• Points projection: 85.1
• Position: 2nd (-)
MK vs Bromley, 11th April.
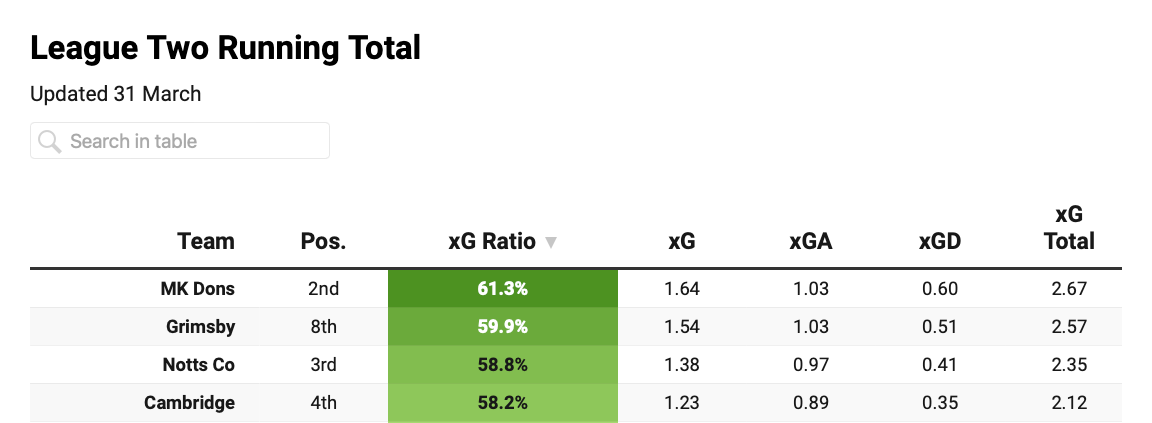
There’s a huge fixture to come; one that suggests there are still chances to make big inroads in the title race. The spreadsheet gives MK the best chance of doing that. They have the best xG ratio in the league over the last 10 games (68.8%) and the second-most points (20), after Oldham (25).
Cambridge
• PPG: 1.85
• Fixtures: 7 (4H / 3A)
• Remaining opponents PPG: 1.59
• Points projection: 84.8
• Position: 3rd (+1)
Three little words: “Game In Hand”. And a few more: “Including one against Bromley”.
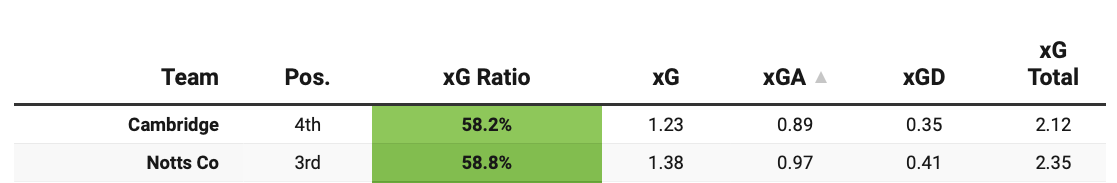
Cambridge (4th) have the best expected goals against (xGA) figure in the league, as one of only two teams averaging less than 1.00 xGA per game. Give it a name: DE-fence. That’s what their promotion credentials are founded upon, and that’s why their game in hand matters: the spreadsheet reckons they’re more likely than not to take points from it, despite the fact that the run-in is pretty tough.
Their list of fixtures goes like this: 5th, 18th, 3rd, 1st, 8th, 23rd. It’s very hard to tell who has what in their hands.
Notts County
• PPG: 1.83
• Fixtures: 6 (3H / 3A)
• Remaining opponents PPG: 1.53
• Points projection: 83.2
• Position: 4th (-1)
The other team averaging less than 1.00 xGA per game are the Magpies. Their issue, per the spreadsheet model, is four little words: “No games in hand”.
That said, there are plenty of reasons to back them to hold on to a top-3 position. Only MK Dons and Oldham can beat their PPG of 1.90 over the last 10 games. Alassana Jatta is in fine form, and then there’s the little matter of a game away to Cambridge on the 11th of April – yep, the same day as MK Dons v Bromley. Mouthwatering.
Salford
• PPG: 1.75
• Fixtures: 6 (3H / 3A)
• Remaining opponents PPG: 1.53
• Points projection: 80.1
• Position: 5th (+1)
While the spreadsheet doesn’t predict a flying finish for Salford, there’s plenty to say in mitigation. And when I say mitigation, I mean for the spreadsheet, which cannot predict hot and cold streaks.
Are Salford cooking? They just beat MK Dons.
Are they cooked? They recently lost to Cambridge.
Will they be cooking? They face 3rd and 7th in back-to-back games.
Will they be cooked? I repeat: They face 3rd and 7th in back-to-back games.
Karl Robinson’s side is chock-full of quality, no doubt. They also have a negative xG share over the last 5 fixtures (49%) and only a shade of positive over 10 (51%). It’s extremely difficult to gauge their level over the run-in. The formula, though, has them moving forwards rather than back – just not all the way.
Swindon
• PPG: 1.75
• Fixtures: 6 (3H / 3A)
• Remaining opponents PPG: 1.65
• Points projection: 79.6
• Position: 6th (-1)
A faller – and might it get worse?
Swindon’s position is rather like Bromley’s, but minus 9 points. Their PPG over the last 10 is 1.50, which is a mid-table range in League Two. They are tripping over the line, not sprinting towards it.
Given they are 7 points clear of 7th place, Swindon should have the points on the board to clear the dotted line designating the play-off places. What lies beneath, however, are a clutch of serious teams, some with a serious number of games in hand.
Most notably…
Grimsby
• PPG: 1.63
• Fixtures: 8 (3H / 5A)
• Remaining opponents PPG: 1.39
• Points projection: 75.0
• Position: 7th (+1)
Some teams have closer to 10% of a season left to play. Grimsby have closer to 20%, albeit skewing heavily away from home. The model has them jumping into the final play-off spot, and no doubt that comes down to their game(s) in hand on opponents – one over some, two over others.
Not only that, though: Dave Artell’s side have consistently posted outstanding xG numbers. If it wasn’t for a rough patch around Christmas, Grimsby might be troubling the top spots, not just the play-offs.
Oldham
• PPG: 1.56
• Fixtures: 7 (3H / 4A)
• Remaining opponents PPG: 1.27
• Points projection: 73.6
• Position: 8th (+2)
Just missing out, but not by much, are Oldham.
They are flying. They have a game in hand on most. They have picked up 25 points from a possible 30. They have the second-best xG share over the last 10 games (64.1%). They have one of the easiest run-ins. They are talking me into the idea that they are going to beat the model and make it into the play-offs.
A word of caution? Micky Mellon’s side probably can’t maintain a 2.50 PPG record over their last 7. It would mean dropping points in only one match. But if they did…
Chesterfield
• PPG: 1.59
• Fixtures: 7 (4H / 3A)
• Remaining opponents PPG: 1.26
• Points projection: 73.5
• Position: 9th (=)
With only Grimsby and Crewe to play from the top 7, Chesterfield have the easiest run-in on paper. It’s not enough, per the spreadsheet, to claw their way into a top-7 spot. But there are plenty of positive signs about the Spireites.
They top the xG charts over 10 games (1.93), and those games have averaged an xG total of 3.04. If a Swindon or a Salford were to hit a fence in the closing straight, Chesterfield could be right amongst it. They’ll need to clock something like 2.00 PPG over their last 7, though.
Crewe
• PPG: 1.58
• Fixtures: 6 (3H / 3A)
• Remaining opponents PPG: 1.59
• Points projection: 73.0
• Position: 10th (-3)
They keep defying the odds. They keep defying what is good and holy. Our spreadsheet has them as the biggest fallers, and their last game, a 2-1 win over Oldham, explains it in a nutshell — it took two out-of-the-box worldies to win.
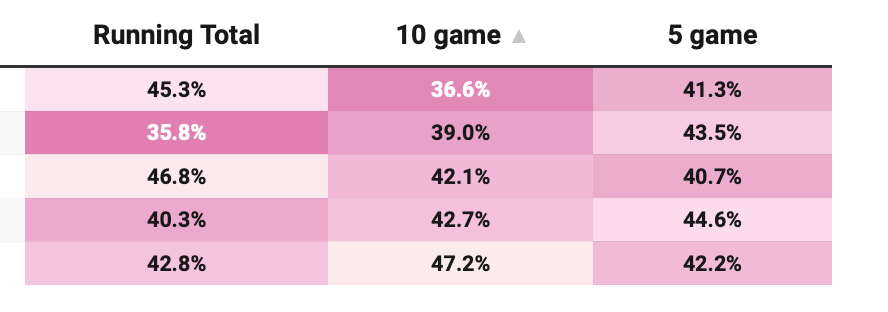
But win they did. So, why is the model marking them down? Let me explain with a quiz. Below is the xG ratio over 5-, 10-, and Season-Long time frames for the teams ranked 7th, 21st, 22nd, 23rd, and 24th in the table. They are not listed in position order. Tell me: which one is Crewe?*
Barnet
• PPG: 1.50
• Fixtures: 6 (3H / 3A)
• Remaining opponents PPG: 1.28
• Points projection: 69.3
• Position: 11th (+1)
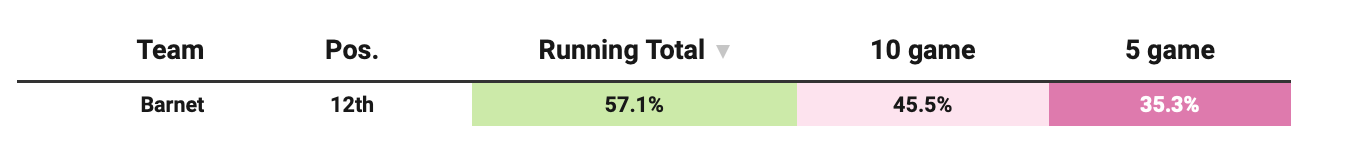
Sweet, fair Barnet.
Rising but not quite enough. Short on games, short on time, but not short on quality, Dean Brennan’s side look likely to fall into the category of the “What If?” season. They have been comfortably within the best teams per the xG tables all season long… until recently. Ouch.
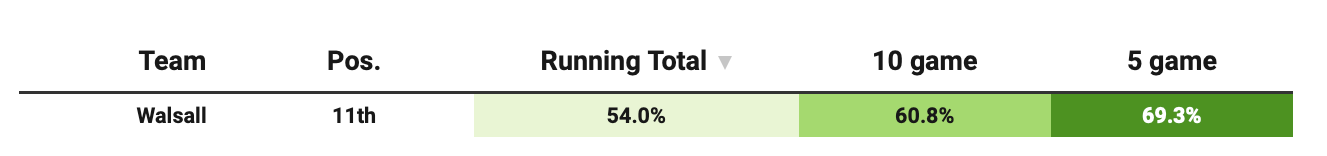
🔵 Walsall
• PPG: 1.53
• Fixtures: 6 (3H / 3A)
• Remaining opponents PPG: 1.27
• Points projection: 69.1
• Position: 12th (-1)
And finally, Walsall.
Never write them off.