

The NTT20 Research Bible (2026)
Our guide to publicly available data sources in football.

Across the thousands of conversations I’ve had with readers, listeners, and watchers of NTT20, there is one question people ask more than any other…
“How do you stay across 72 teams?”

The answer is simple: research — but not in the sense of trying to watch every minute or memorise every number. To give you an idea, a Monday Pod workday lasts around 11 hours, and more than half of that time is spent on two distinct types of work: (1) watching football, selectively and with intent, and (2) poring over a teeming array of publicly available data sources to add context, challenge assumptions and fill in the gaps.
This research bible sets out the tools and resources that make that process possible.
Watching
With well over 3,000 minutes of EFL football taking place across every full slate in a weekend, there are quite literally not enough hours in the day to watch it all. Still, you have to judge a book by its cover. You have to give it the eye-test.
Highlights packages
EFL matches are typically available as ~10-minute extended highlights, ~4-minute packages, or ~2-minute clips.
The EFL YouTube channel releases a small number of extended highlights each round, while most clubs place theirs behind logins on official sites.
SkySports.com (or the Sky Sports app) is the best fallback for shorter highlights, offering 4–2 minute packages with 4–10 key incidents per match.
For quick league-wide coverage, Sky allows you to watch every match in a division in around 25 minutes by cycling through tabs.
Wyscout
A paid professional scouting platform used for in-depth player and team analysis.
Provides searchable video clips by action type, role, and phase of play for every EFL player.
Includes extensive team and player data, plus auto-generated scouting reports.
Expensive (just under £1,000 per year), but invaluable for understanding player tendencies and supporting transfer research; increasingly out of reach for fans and fan analysts.
Publicly Available Data Sources
Without watching football matches, you can’t spin an authentic yarn. Yet there is so much more value to be added through statistical, analytical and insight-led information. This is what brings context and colour to the story; the gloss, the final sheen.
Here are the sites and resources I use, and why.
FotMob
The one to use on your phone
On a matchday, this is the ‘live scores app’ for me. I love the layout. Love the live stats. Love the visuals and interface. When attempting to stay across multiple events happening at the same time, you can get a good sense of the state of play at a click.
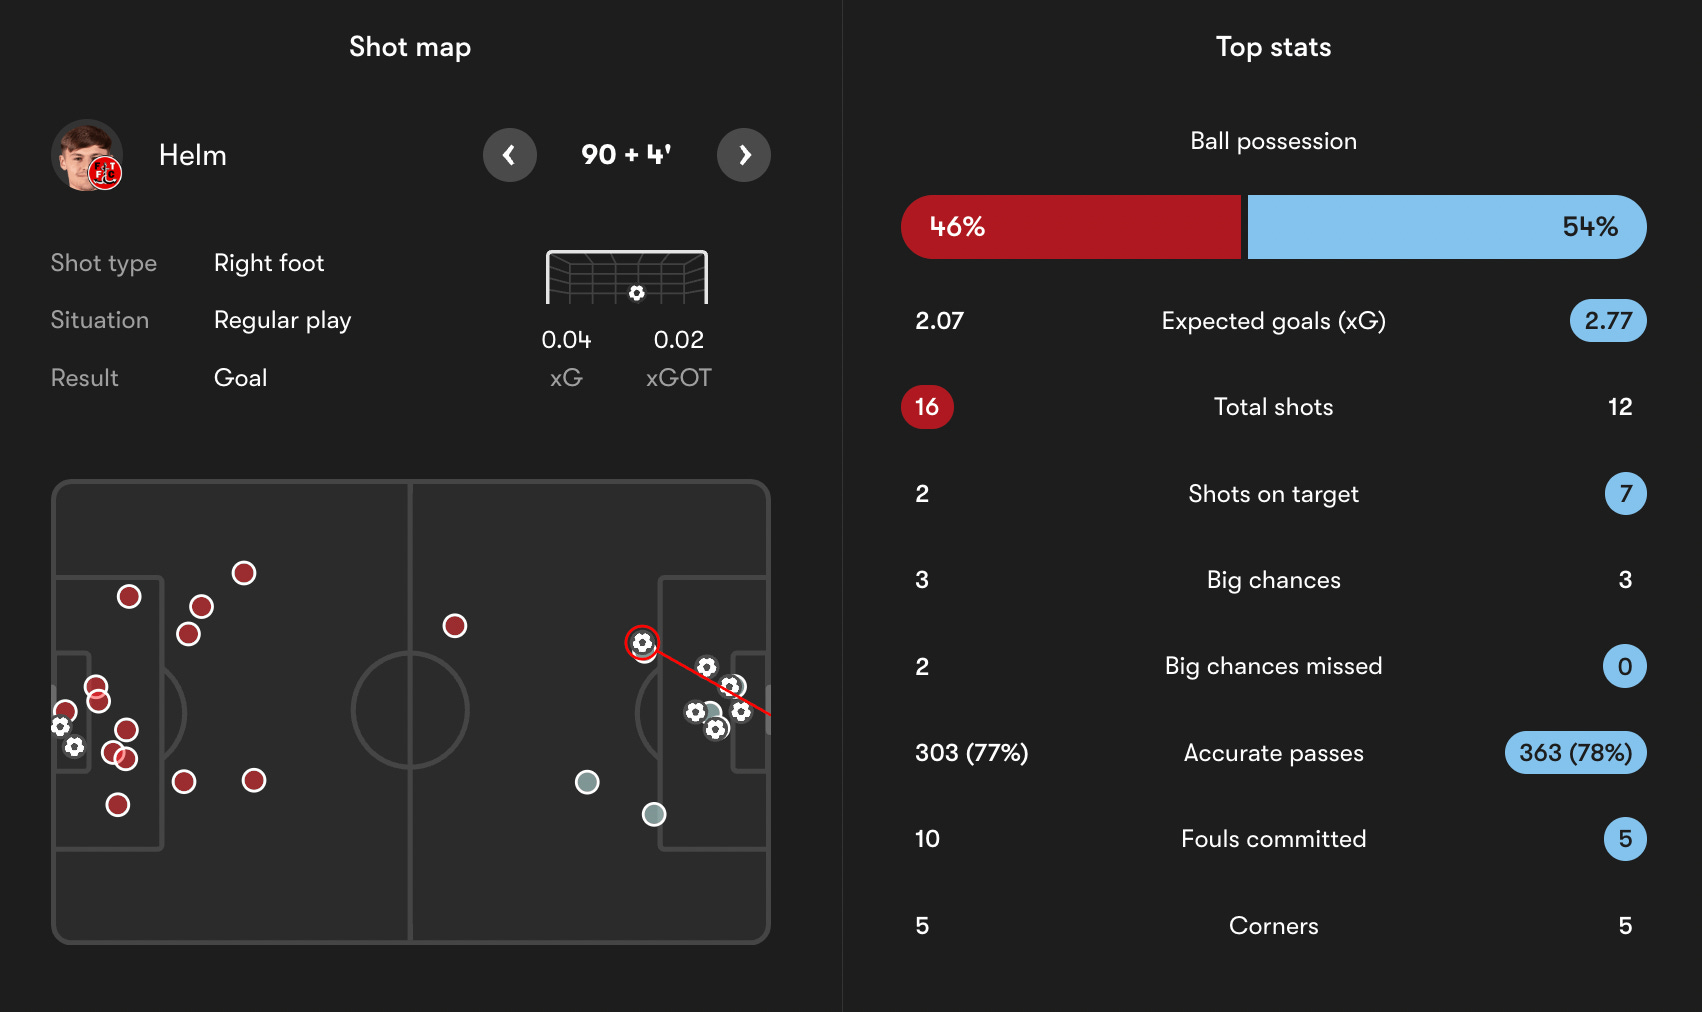
Outside of a matchday, I still use FotMob a lot, especially on mobile. The horizontal nature of stats and tables means similar sites are terrible for mobile device screens – not this one. On the phone, I’ll use FotMob for all sorts of stats and player/team stuff, including xGOT visuals (where players are placing their shots).
Sofascore
The one for average positions, side-by-side views and pass maps
The main thing that I use Sofascore for is average position maps, but these are very important to me. Although all apps publish a team line-up ‘in formation’, these can’t always be taken as gospel.
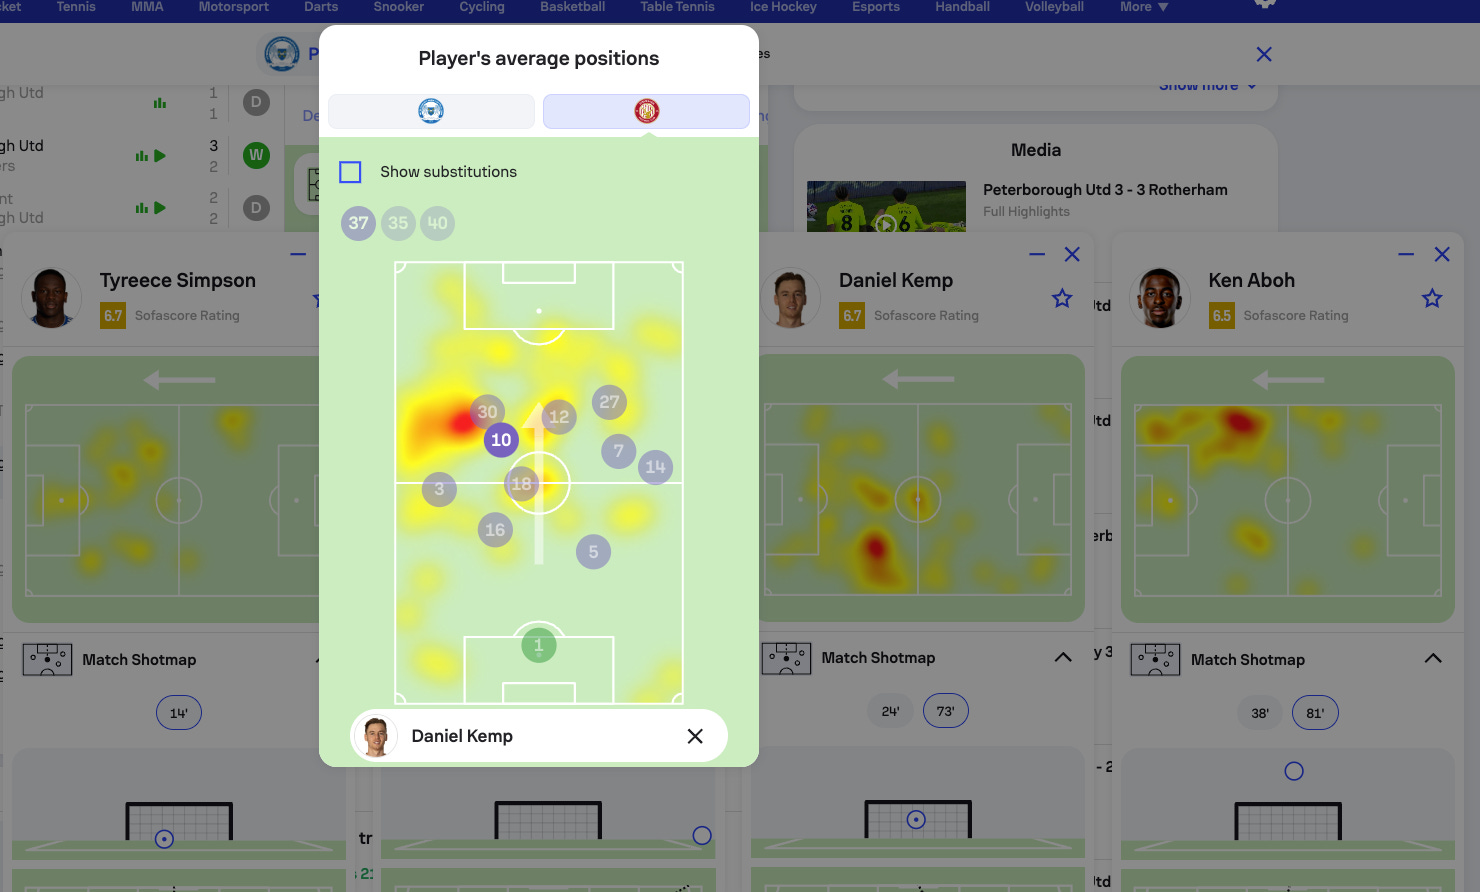
Using the average touch maps gives me a better idea of how teams are shaping up in possession and can provide a few tactical pointers to then study more deeply elsewhere.
Sofascore also allows for side-by-side comparisons of different player stats from specific matches, or the same player from different matches, which can be really handy. All the more handy now they have added maps for shooting, passing, dribbling and defending.

FBref
The one you can customise
For some, the 1980s spreadsheet-like visuals of FBref are a turn-off. Not for me. The fact that all of the metrics/stats are contained on one page and so easily sortable makes it an incredibly useful resource. Moreover, the data can be easily copied and pasted into Sheets or Excel so you can adapt their information into your spreadsheets.

Unfortunately, the advanced data (from xG to shot-creating actions) that was once contained on this site has now been removed. This is terrible news which we’re still coming to terms with.
Despite this, I will likely still use FBref to get basic stats on a career level (e.g. seeing Joe Garner’s 20 year-career and goalscoring record mapped out neatly) and also on a club level (e.g. seeing who has played the most minutes for each team).
Streamlit
The one that’s a sandbox of EFL statistics
Streamlit isn’t a football product in itself; it’s an “open-source Python framework for data scientists and AI/ML engineers to deliver interactive data apps”. Basically, smart people use it to build their own stats sites. Specifically, we like Ben Griffis.


Ben has built an incredible resource for EFL fans, with advanced data (via Opta) available for every club in the 72. It’s a huge playground with so much to discover and explore, whether that’s team-specific stuff or overall league rankings. Jump in, nerd out.
We also are huge WT Analysis fans. I like the player radar generator and seeing the a breakdown of a player’s minutes in certain positions.


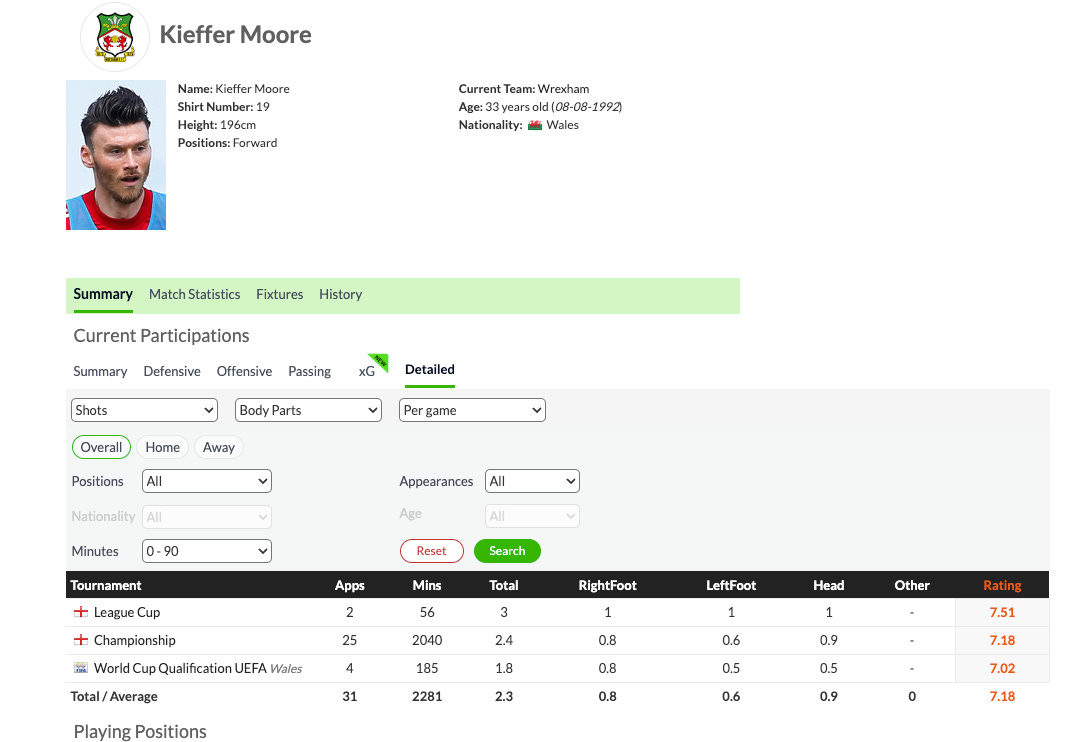
WhoScored
The one with the tweakable match centre and goal/shot-type breakdown
WhoScored has a good match centre, which I often use. You can change the match timeline to only include, for example, the period between 60-90 minutes, which could be helpful for seeing how things looked after substitutions were made or following a red card.
In terms of its statistics database, it breaks down a lot of stats into helpful categories. For example, if I want to know how many goals Kieffer Moore has scored with his head, his left foot and his right foot, I’d go to WhoScored’s detailed player stats tab.
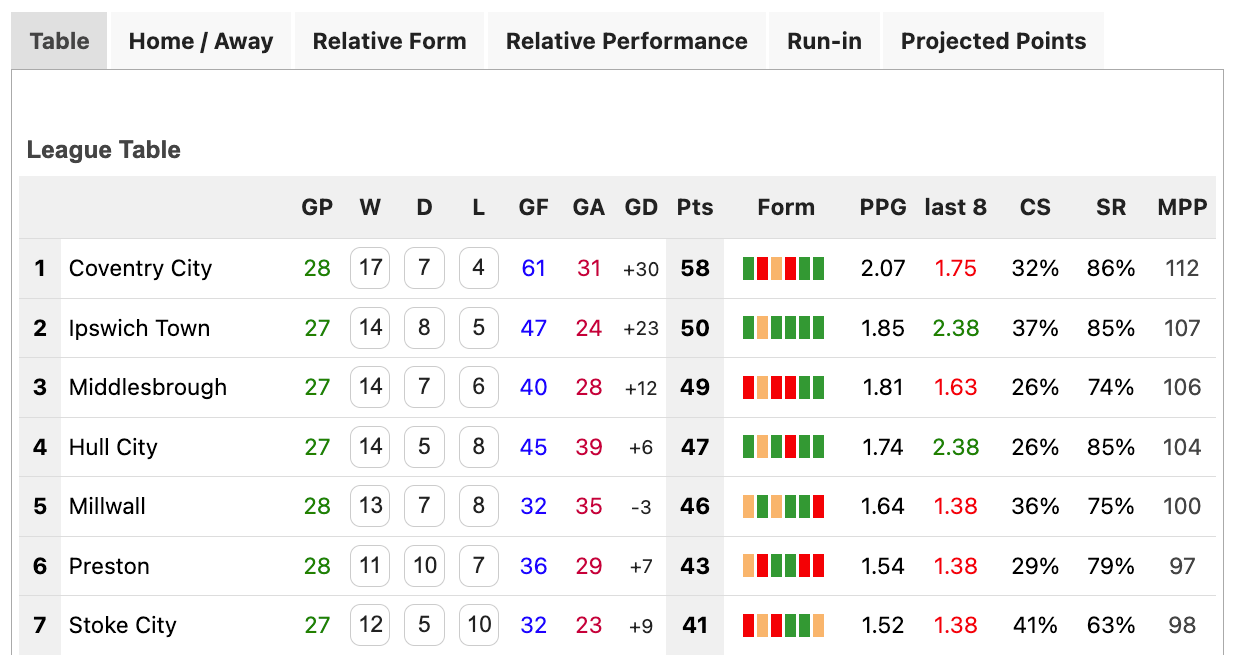
SoccerSTATS
The one with the ultimate league table… and almost everything else
God, I love SoccerSTATS.
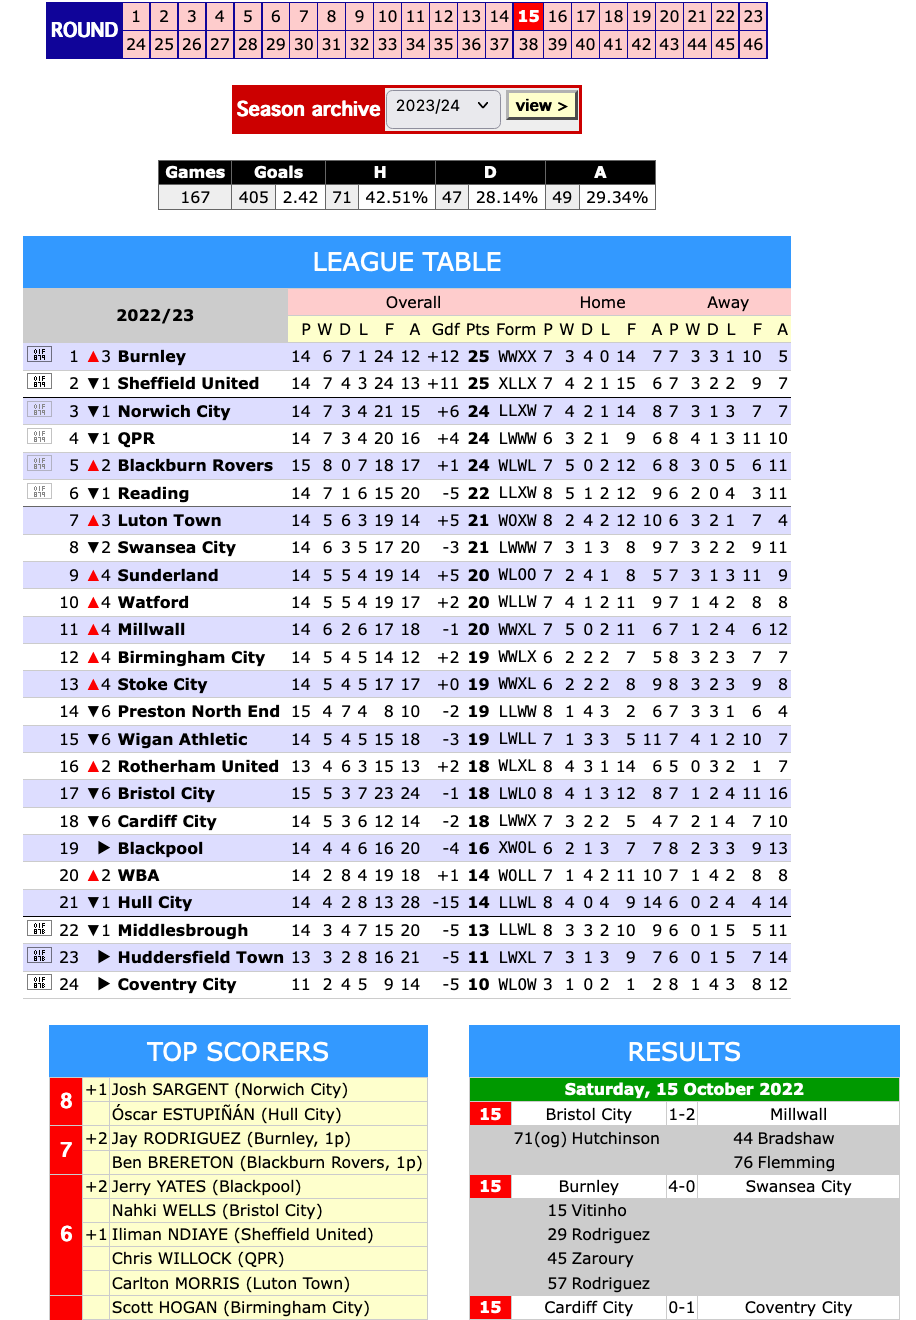
Most sites show a league table, but SoccerSTATS produces my league table of choice. There’s just enough detail and not too much. It’s clean, but with a pop of colour in the right places to guide you.
But that’s not the full extent of SoccerSTATS. Not even close.
On the team page, I’m getting tons of stuff, broken down nicely and well presented: colour-coded recent results, for example, and a results table that gives an instant visual of fixture dispersion and difficulty, as well as certain trends in a team’s results.
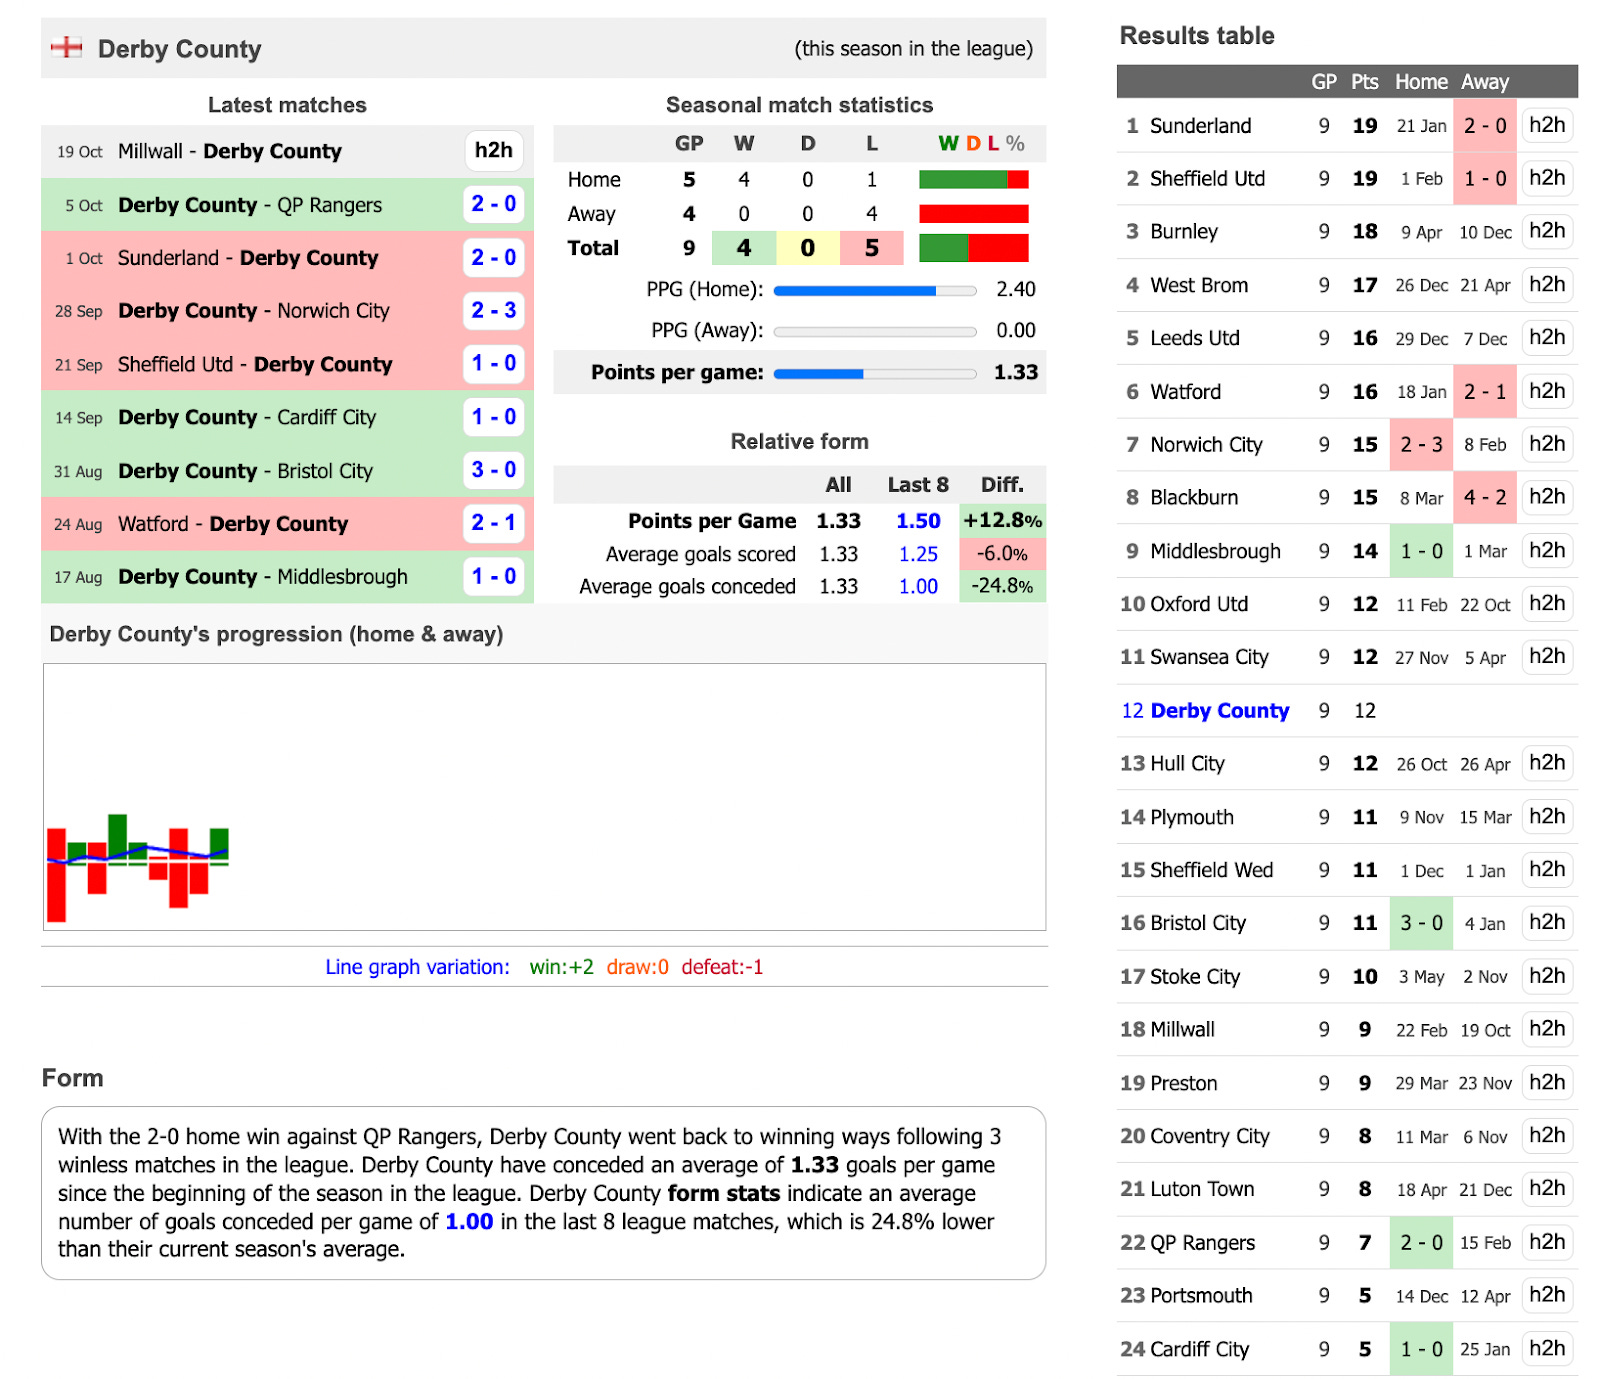
Scroll down further and you get tons and tons and tons of other interesting, valuable stats on a team. But it’s not just contained to team pages; it’s all collated and available on a divisional level as well.
As it does on a team page, the ‘Statistics’ button on a division’s page opens up a whole new world. This is my Narnia.
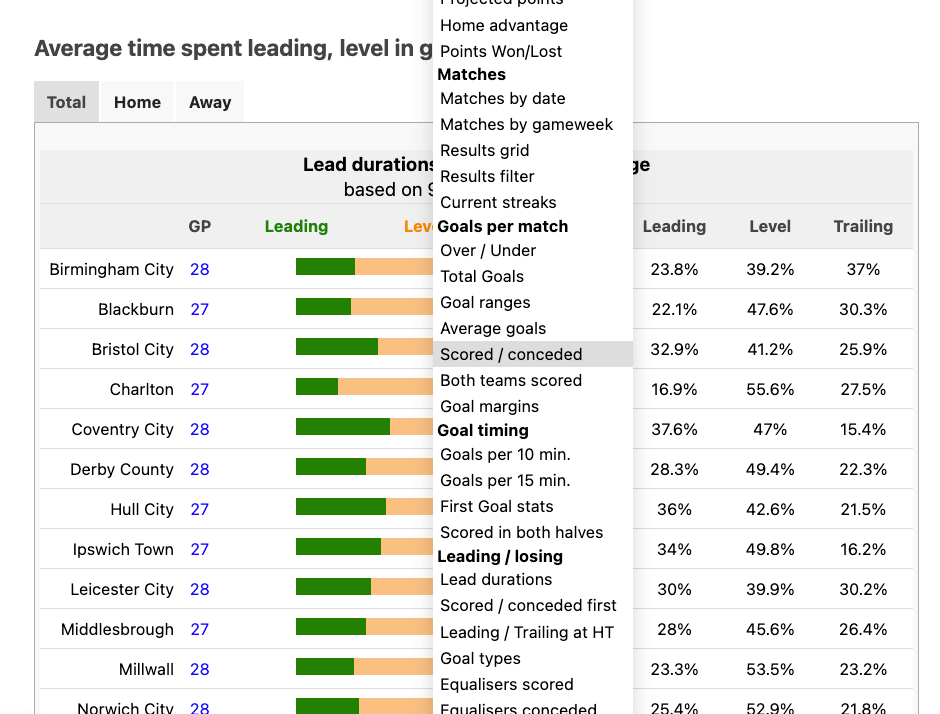
I won’t spam you with any more screenshots, but I’m not lying when I say I would look at the following stats every single week, in one form or another:
Home/Away tables
Form tables (you can choose between 4-6-8-10-12 games – brilliant!)
Run-in analysis (giving you a good breakdown of fixture difficulty, both in games played and those to come, also considering each opponent’s home/away bias)
Goals stats (over/under, both teams scored, number scored/conceded – perfect for my obsession with zeroes and ones!)
Goal times
Lead durations
Scored/conceded first
Opta Analyst
The one with advanced metrics and set-piece stats
For a long time, Opta pretended that the EFL didn’t exist in terms of their publicly available data. Now they’ve gone the other way, and we’ve all benefited from it. Thanks, Opta.
Their Analyst site has detailed stats on a team level and a player level for each of the three leagues. It’s easy to sort, easy to navigate, and a great way to see rankings for advanced metrics.

It’s the best place to get goalkeeper shot-stopping data and set-piece data, with an essential trove of information that helps to peel away those extra layers of team performance. It’s also the best place to use data metrics to build a snapshot of team style and approach, with breakdowns of attacking and defensive numbers into specific stylistic categories.
Not The Top Table
The one with xG form guides for all three leagues
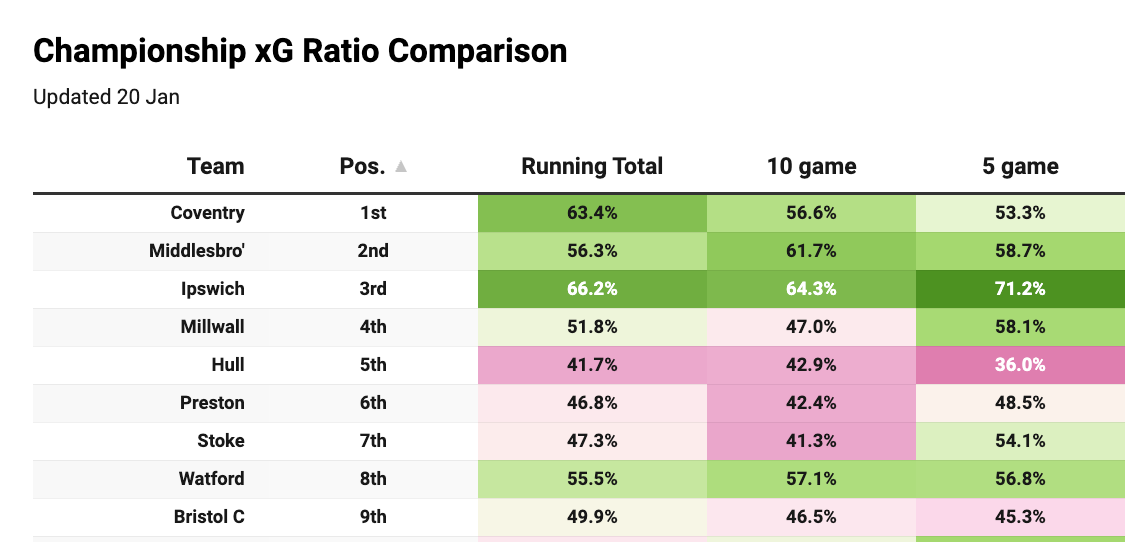
Late last year we launched our own — and the only — xG form guides covering all three EFL leagues. These tables show how teams are performing beneath the surface, based on the quality of chances they create and concede.

Specifically, we focus on xG ratio: the share of total xG that one team has in each game. We look at this across 5- and 10-game form guides, season long, and as a comparison.
Transfermarkt
The one for pre-season and player-level research
The best kind of research is pre-season research. Spending a few weeks before the 1-24s with my head buried in research resources and my special information spreadsheet, without the urgency of the in-season content cycle? That’s as good as it gets for me.
And Transfermarkt is the KING for pre-season research, for two key reasons:
It has all of the best, up-to-date transfer information on a division level or a team level, perfectly laid out.
It has a ‘squad by position’ page that gives you a good overview of a squad’s composition.
Here’s an example of a nicely constructed squad, recruited to a specific shape/style (3-5-2) but with other options in certain scenarios:

However, it isn’t confined to pre-season, nor transfers. It’s massive for player research.
If I want to learn about a player’s career, I would almost always go to their Transfermarkt page first. I like to go on the ‘all seasons’ page on the Stats tab and get a snapshot of a player’s career so far.
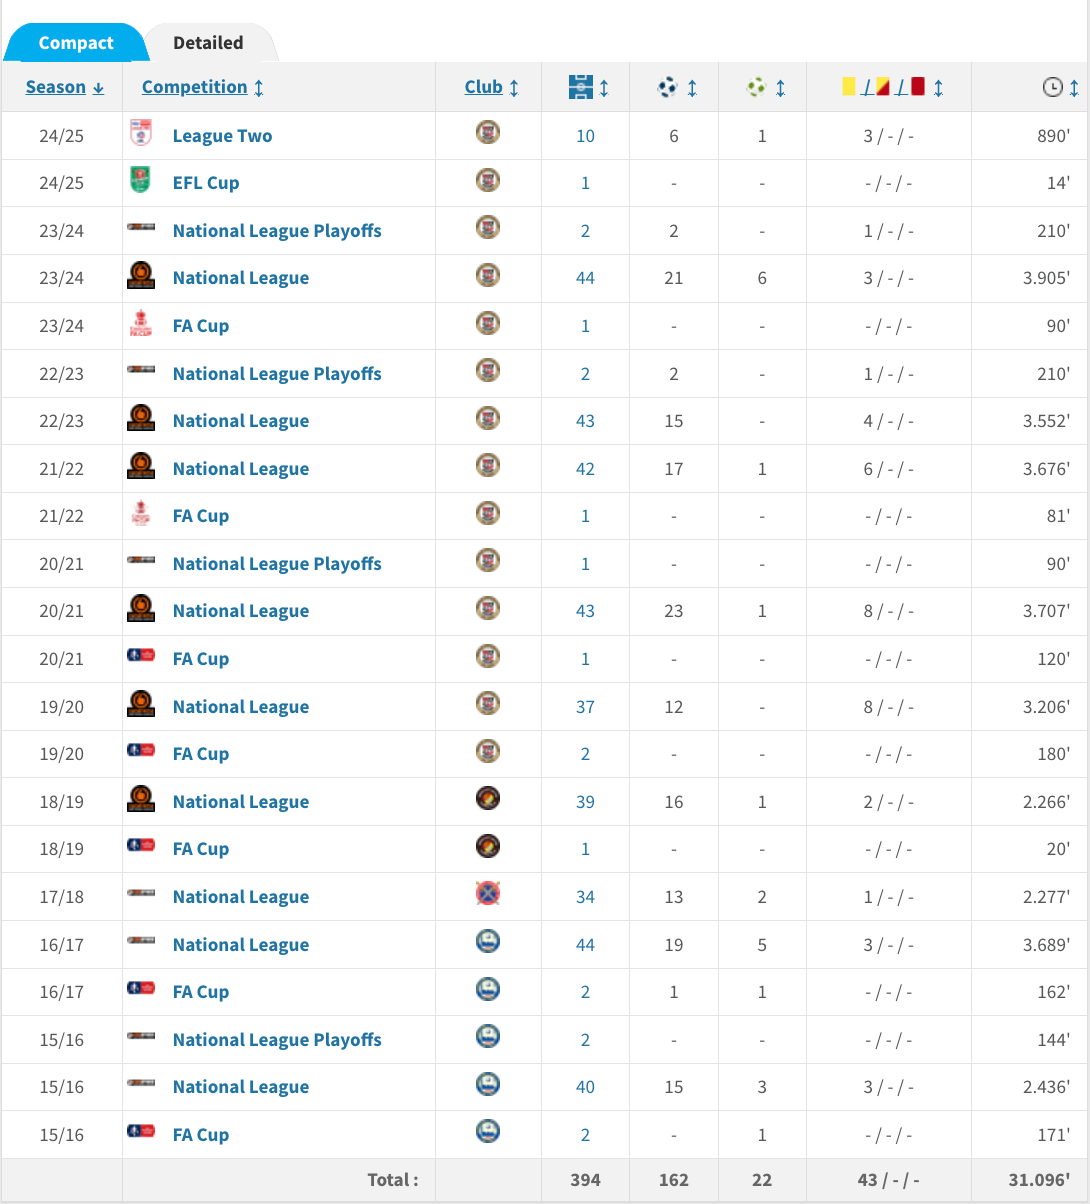
It’s great for seeing how much a player has actually played and how often they’ve been absent through injury, and for how long. There are also figures for how many appearances a player has played in each position on the pitch, as well as their record against opposition teams and even individual players. And Transfermarkt is rare in that it offers a comprehensive overview of every player’s international career, which can sometimes be useful.
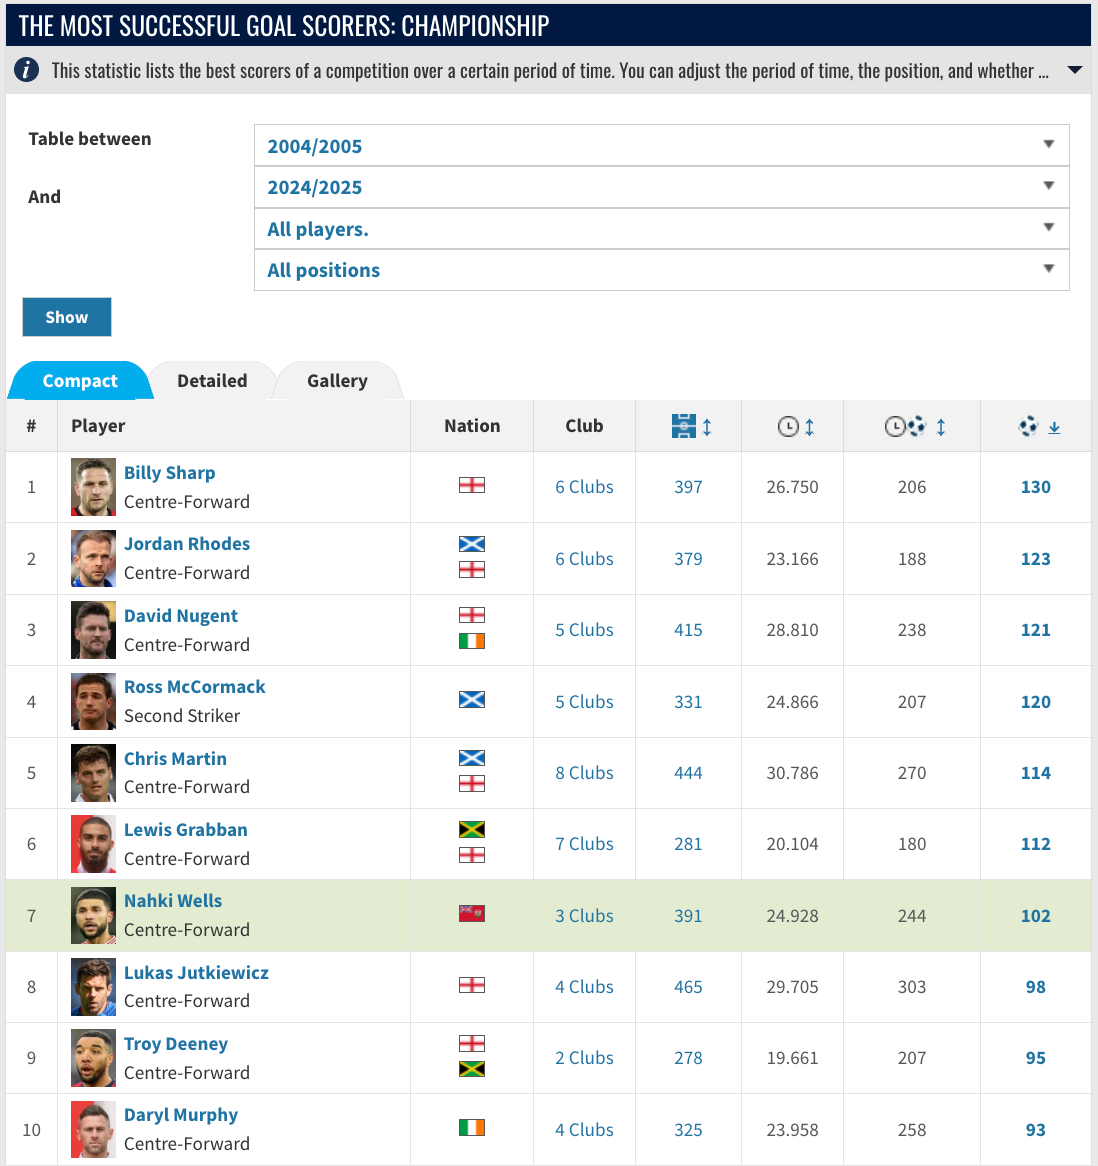
P.S. Because it’s a German product translated into English, some of the phrasing is iconic, such as the ‘Eternal goalscorers’ of the Championship.
And now for some nice-to-haves from NTT20 writers:
TWTD
The one with a lovely form guide and date-range sorting
This one gets the nod from Sam:
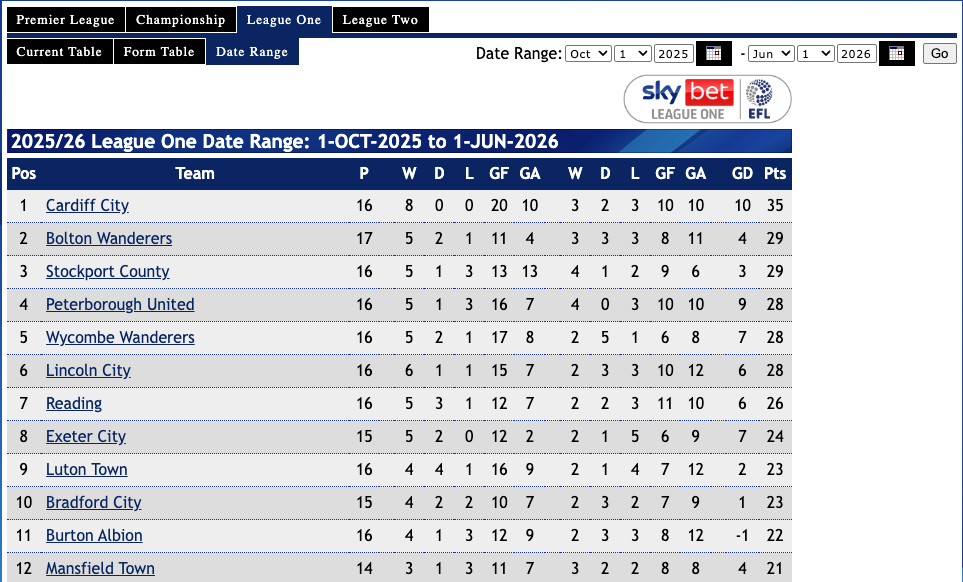
Sometimes you just need a bell-clear form guide with enough customisation to answer a question. For example, if I wanted to know ‘Which team has secured the most points since X Manager was hired?’ or ‘How do Sunderland’s and Coventry’s points tally up over two seasons?’, I would use TWTD’s form guide page. An Ipswich fan board may seem an odd place to look, but it works. Many of these sites publish the same information, but it’s all about ease of use, and this is easy, intuitive and seamlessly customisable.
Soccerbase
The one for player availability and head-to-head records
And this one gets the nod from Huw:
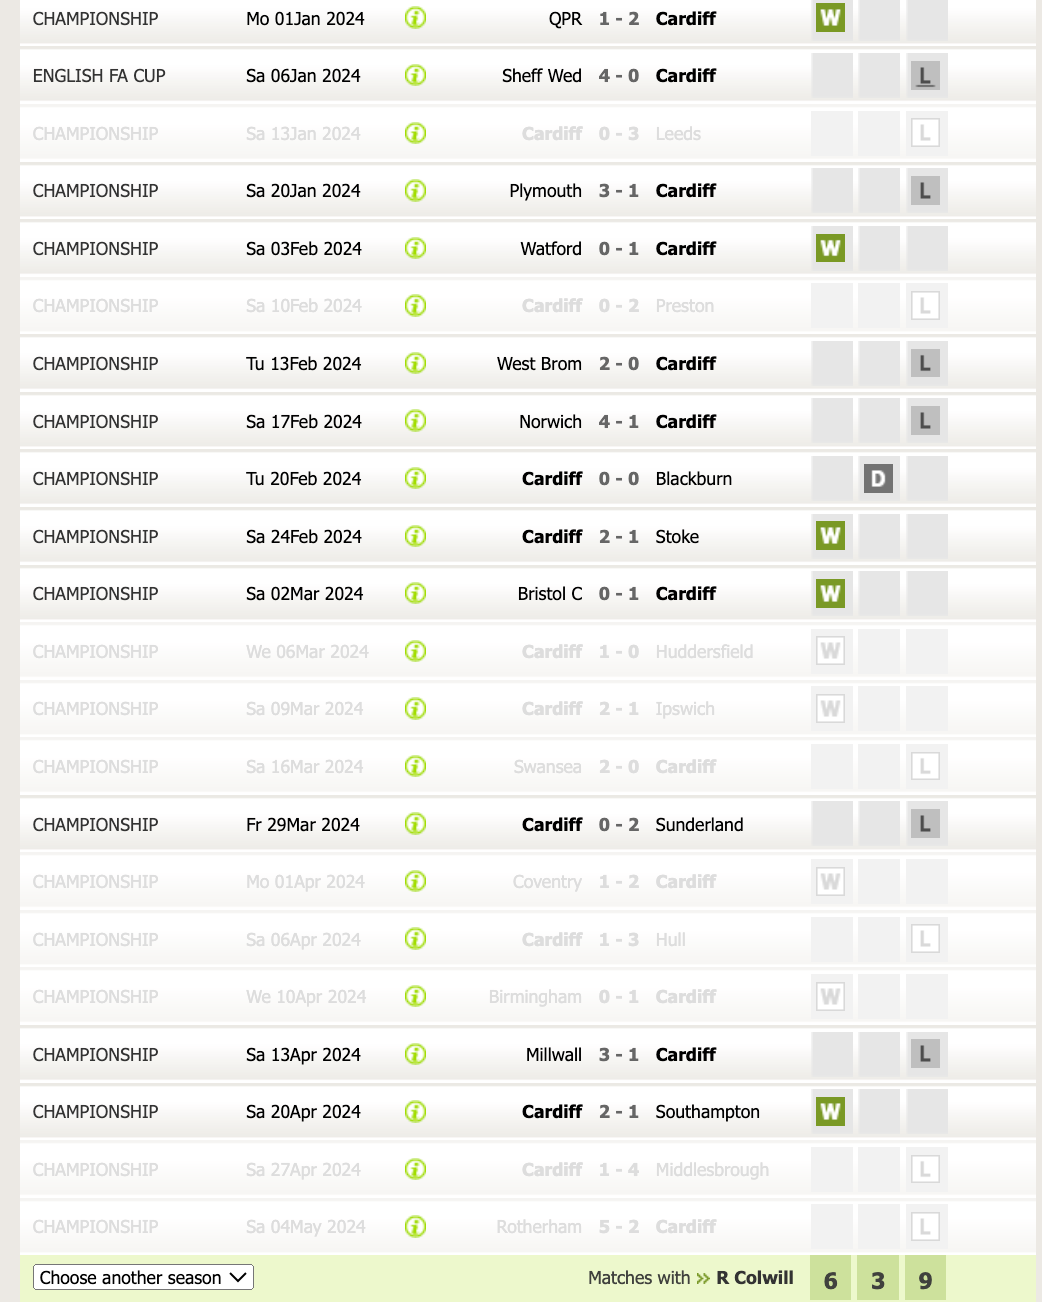
Soccerbase has a ‘Player Filter’ button on every team’s results page, so you can have a simple overview of matches that were played with or without a specific player – not for ‘win percentage’ guff, which is provided but can be a badly misused statistic, but for information such as availability and consistency of selection. You can choose to include or exclude substitute appearances, too.
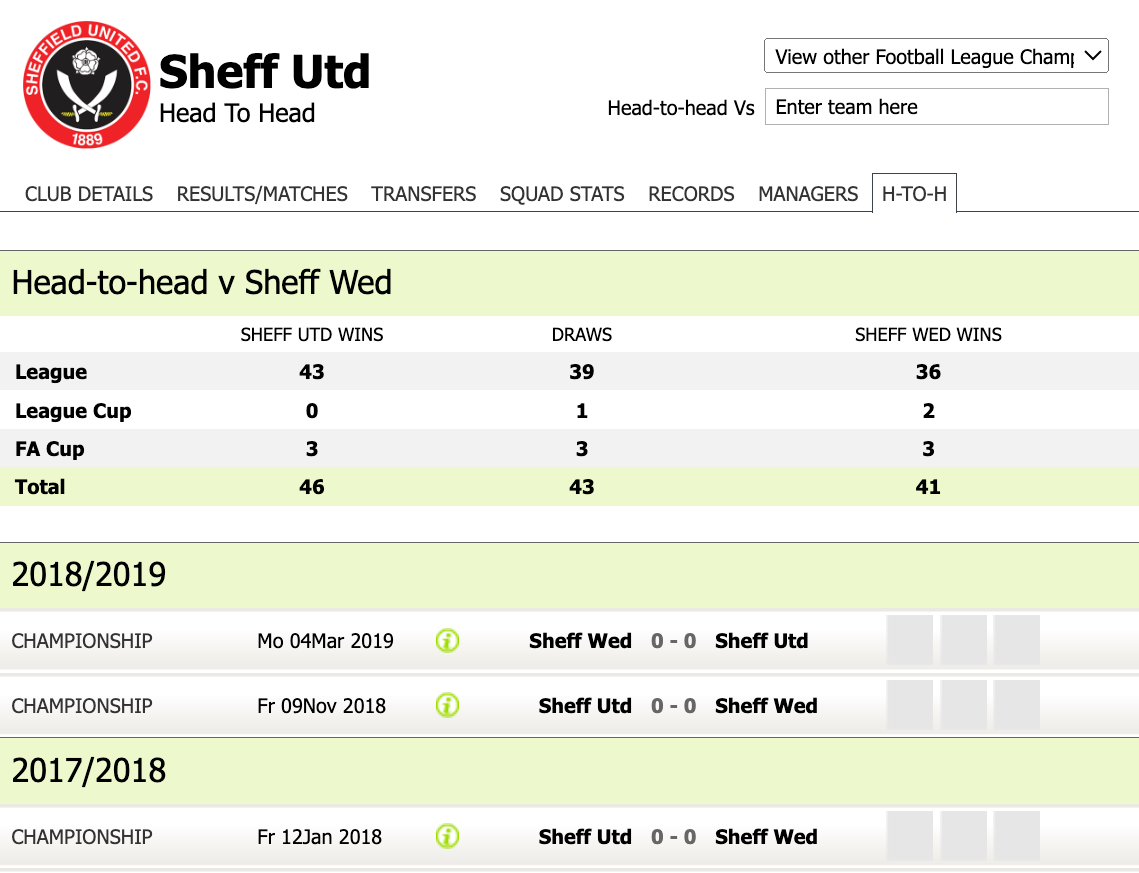
Soccerbase offers another service that puts the ‘fun’ into functionality, and that’s its historical head-to-head records between teams. Here’s why some of us weren’t especially hyped for the return of the Steel City Derby in 2024/25… and both games duly finished 1-0 (to United).
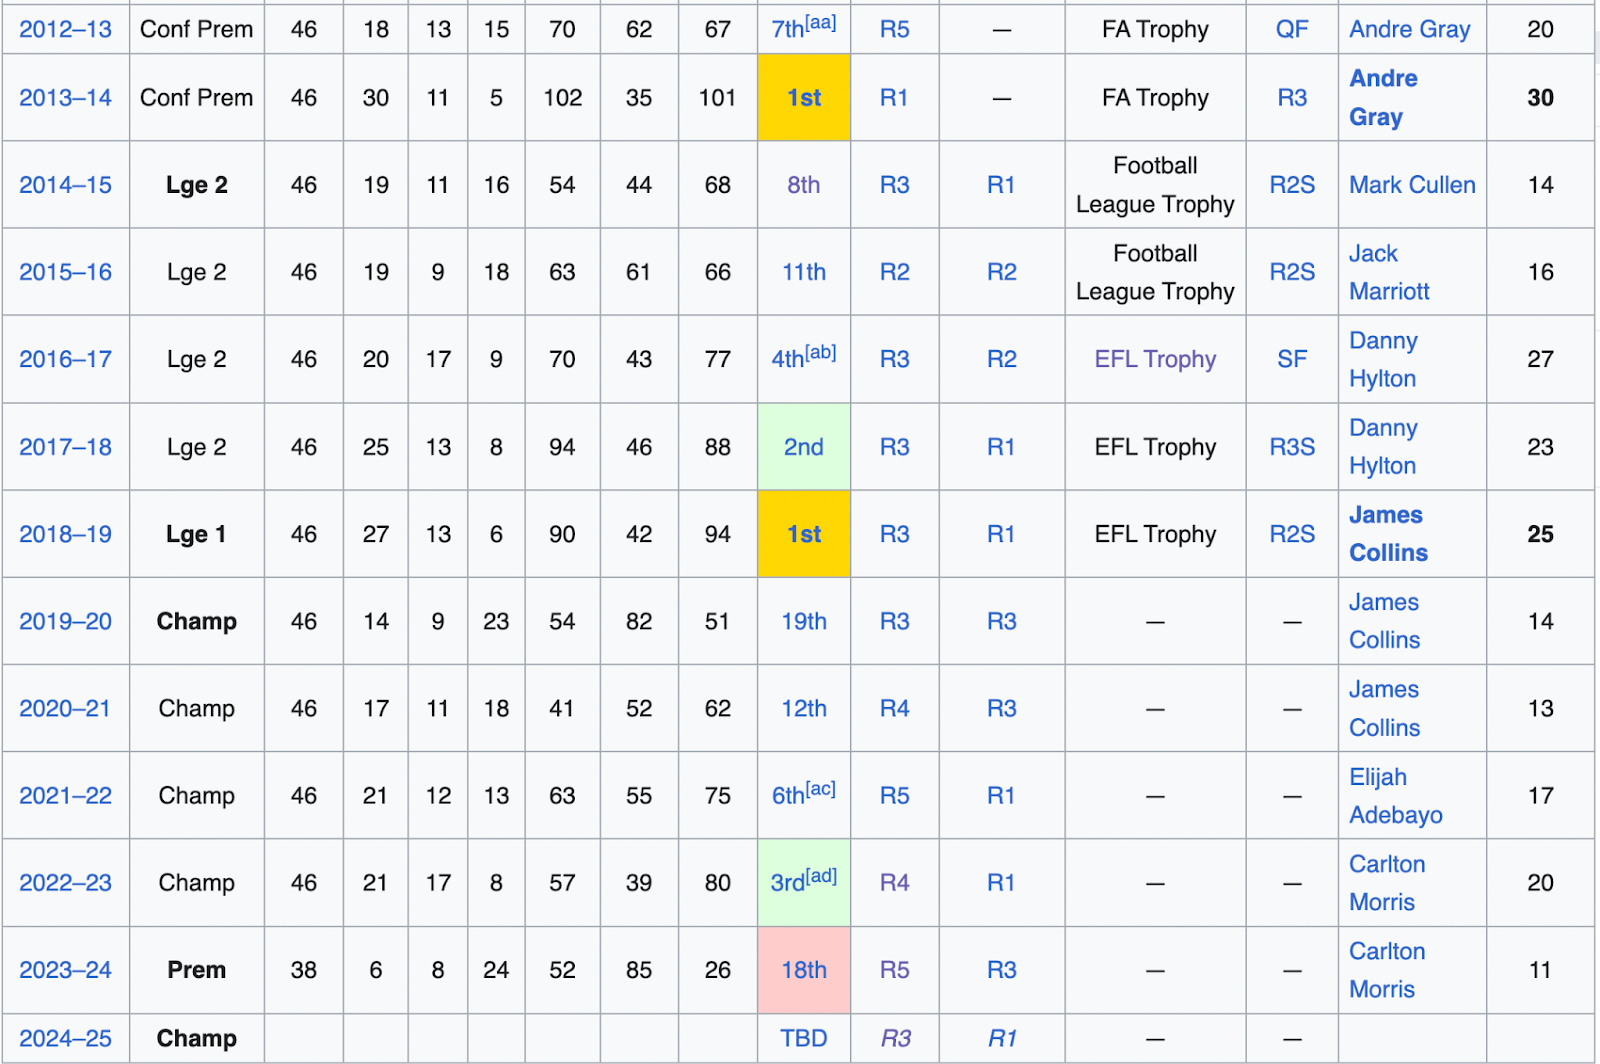
Wikipedia
The one for historical snapshots
This doesn’t need much introduction. However, my personal Wiki use tends to rely heavily on these two things:
Searching ‘List of [TEAM NAME] seasons’
It’s just a great overview of a club’s footballing history and migration between divisions.
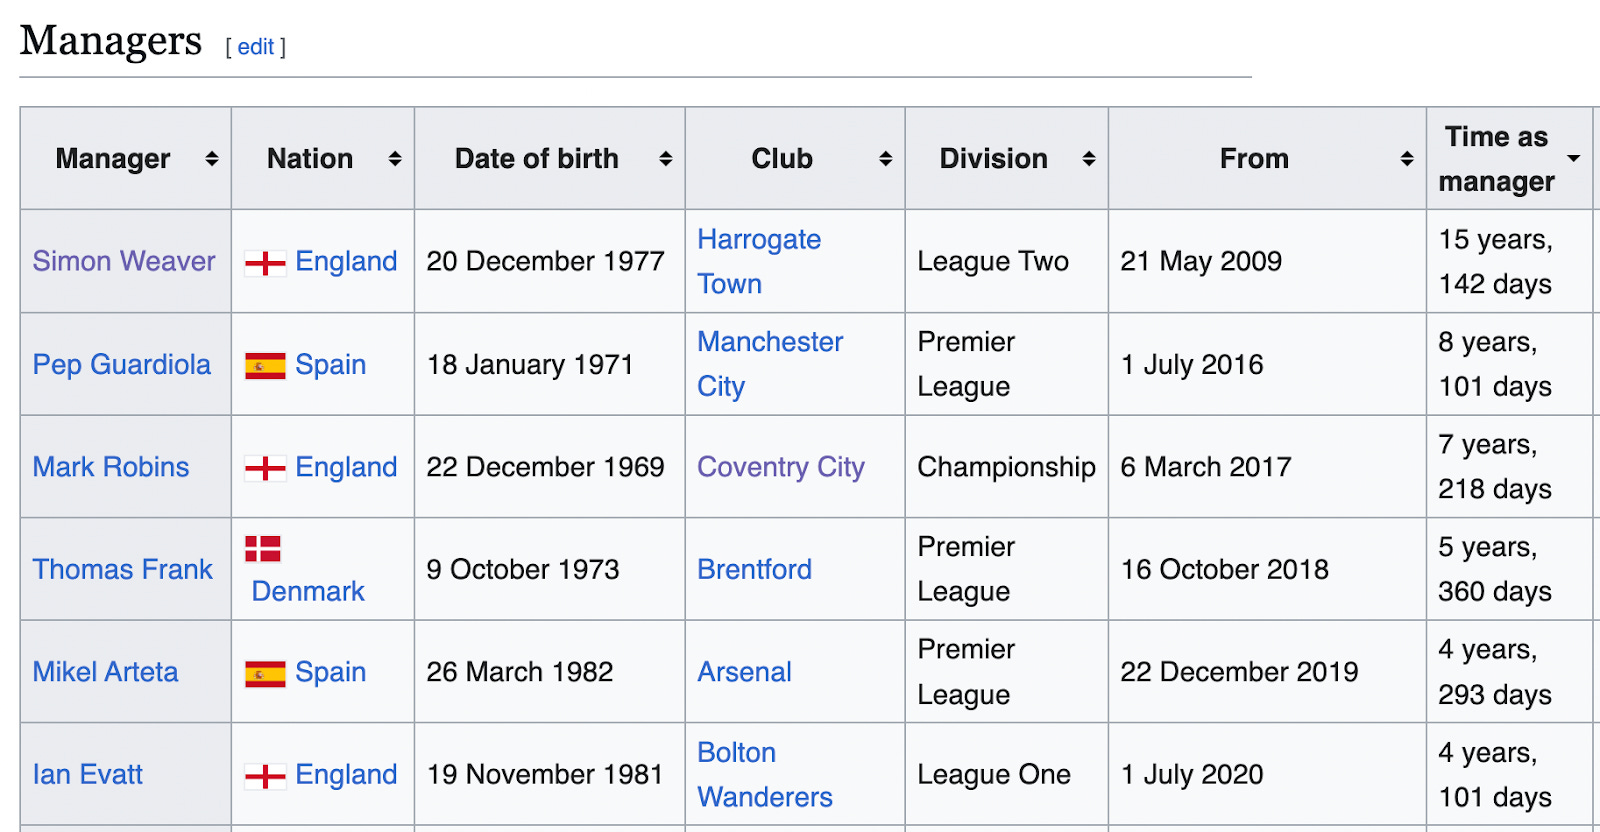
For any question we get about EFL managers, this page is crucial as it has them all in one place, filterable by division, age, nationality and length of tenure. It’s a big old chef’s kiss.
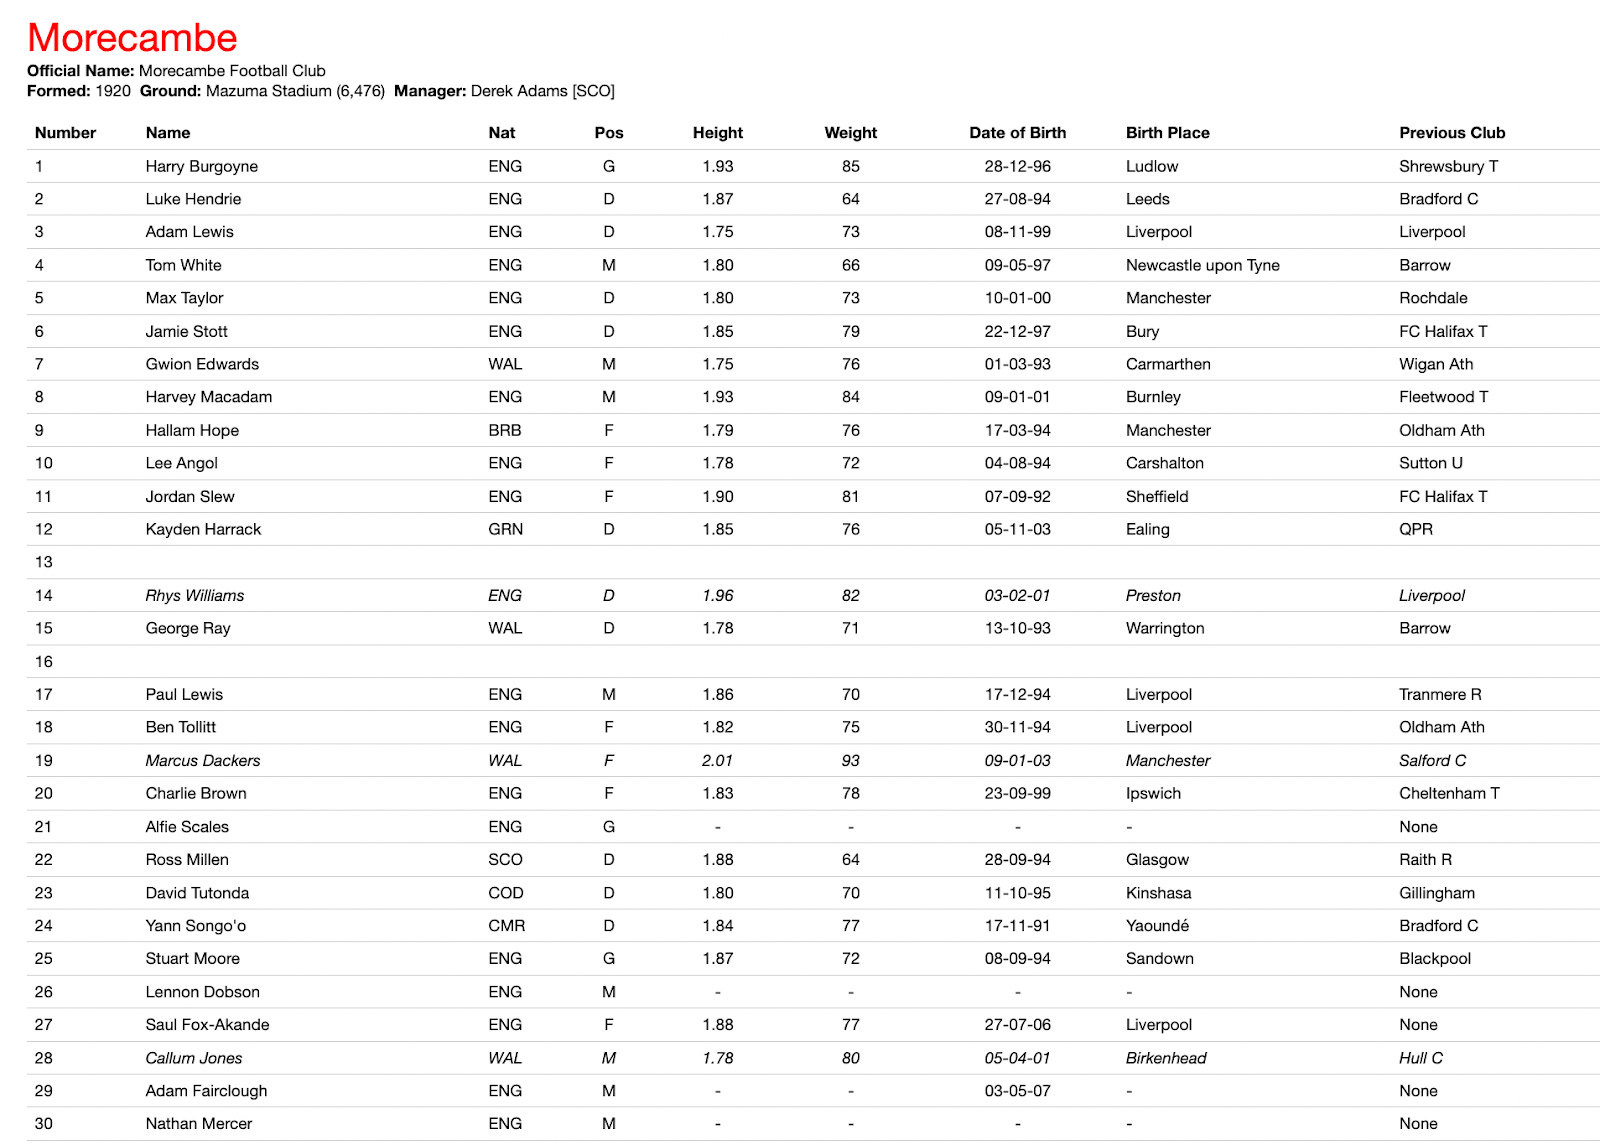
FootballSquads
The one for the number on the jersey
This has become my favourite resource for squad numbers. It’s quick and easy to navigate and it’s laid out brilliantly. If I’m watching a game and I want to know who #29 is, there are plenty of ways of finding that out, but I like this site.
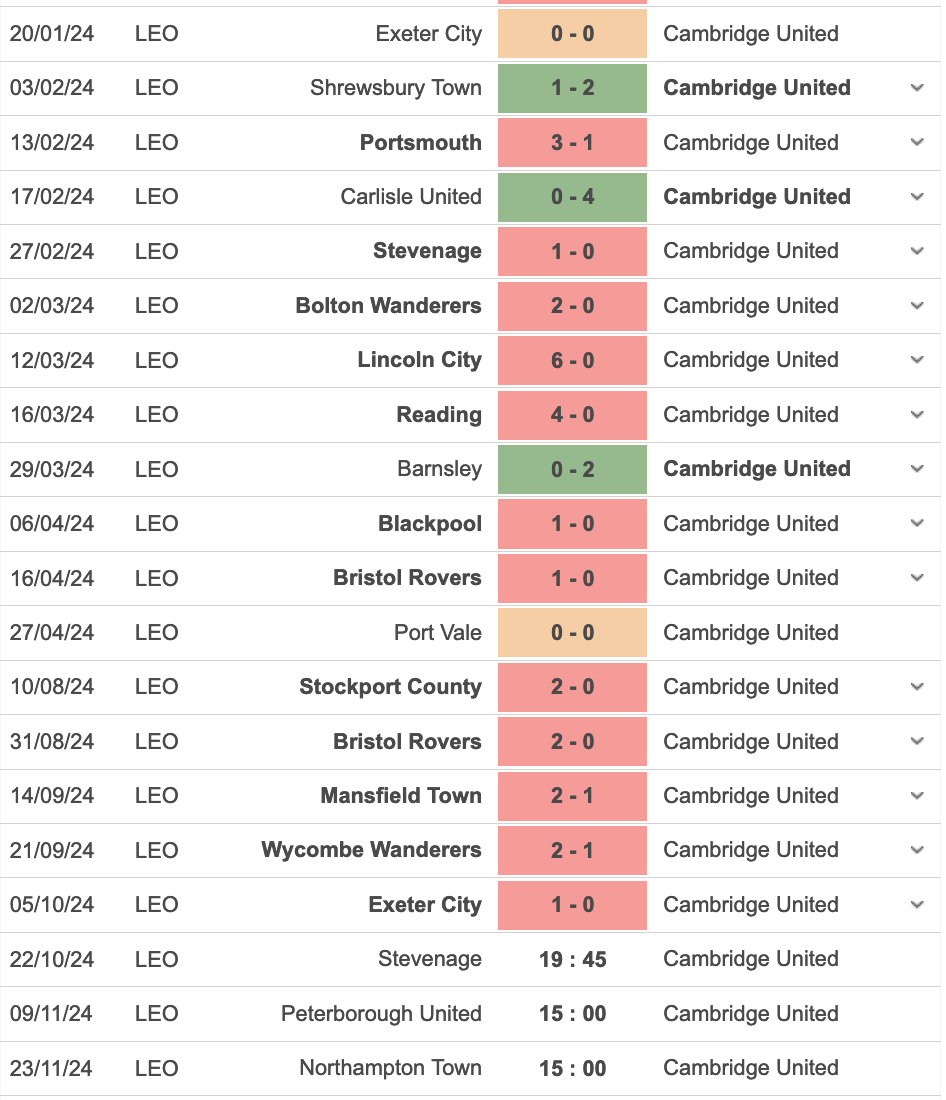
Soccerway
The one with a customisable results list
If you want to have a quick and easy scan of a club’s results specifically in away games, or home games, or only in certain competitions, all presented in a nice, clear, colour-coded layout, then Soccerway can cater to your very specific need.
SoccerAssociation
The one with clear historical matchday tables
Here’s Huw again:
A few different sites offer historical league tables, but I find SoccerAssociation the quickest and simplest to use. It’s done by matchday rather than date, removing the (occasionally useful) intricacies of rearranged fixtures which can inhibit ease of searching, and the layout allows you to instantly click from one matchday to another, without having to manually input dates. It even gives you the league’s top scorers at the time as well. It does cover only the past 25 seasons or so, however, so for older historical tables you’ll want to use 11v11.com, which goes by dates, or Transfermarkt.
NTT20 Squad
The one-stop shop for EVERYTHING EFL
Where before I used to delight in the quality of EFL conversation, information and humour on Twitter, I now get that from NTT20 Squad.
Yes, it’s our own community, and it’s subscriber-only. I’m not trying to sell it to you. But I am very proud of it. Launched in 2021, we managed to establish a community full of good humour, respect and kindness – but also a place where there’s desire for EFL news, knowledge and insight, plus a culture that encourages sharing.
Before every Monday pod, I read through the Championship, League One and League Two chat threads from the weekend. From the fans writing their match recaps, I get detail, emotional reactions, delight, despair and a ton of nice extra context that you’d never get from any other media source.
Weekend Notes on NTT20.COM
The one where we do it for you
Our first ever product on NTT20.COM was Weekend Notes. Over the summer, it underwent a revamp and now it provides a distillation of the EFL weekend in stats, stories and opinion. We do a lot of research, and some of it might not make the pod, but here we provide the best bite-sized overview in newsletter form every Monday morning.
Please add your own resources in the comments. There is surely something we’ve missed. And there are surely sites we could add — and we will update this page with your best suggestions. Let us know what they are and why you use them. Together we can write a great bible for people to keep coming back to.
Great input into how you go about your business boys ⚽️👏
This is brilliant. And this is not a recommendation, more a question to you that maybe you can approach in a future DAG. all the data. so much data. But how do you cut through something like West Brom 0 Norwich 5, where Norwich lost the XG, the possession stats, West Brom had more shots, more corners, similar amount of touches in opposition box... usually the response to this is "well, Norwich ran hot and it's not sustainable" but apart from a 15 minute period before half time Norwich were so dominant that actually it wasn't a surprise they won so convincingly (although it was a surprise because Norwich are never so clinical!).
I love the Not The Top Tables and they broadly have been such a good indicator of the Clement factor as we're now in mid-table in them - but in this instance I guess they'd dip the five match grouping down for Norwich when anyone who watches them can see that they're so much better in both boxes.
Guess you just have to say this is a one-off but is it still a reminder that you also need the eye test? Fascinated to understand how you approach the outliers (like Hull!) basically.